🚀 Supercharge your YouTube channel's growth with AI.
Try YTGrowAI FreePyspark Tutorial – A Beginner’s Reference [With 5 Easy Examples]

This article is whole and sole about the most famous framework library Pyspark. For Big Data and Data Analytics, Apache Spark is the user’s choice. This is due to some of its cool features that we will discuss. But before we do that, let’s start with understanding the different pieces of PySpark, starting with Big Data and then Apache Spark.
Also read: PyGame Tutorial: Graphical Hi-Lo Game in Python
What is Big Data?
In this online era, every piece of information is available on Social Media, News, and other big Telemedia. Just a few years ago, this was not possible. Everything was kept in files or physical paper records. But today this is quite easier. For this, we all knowingly or unknowingly generate a lot of data that needs a lot of process and analysis in real-time.
Thus, from the den of technology, a new field comes out which is – Big Data.
This term defines the definition through the name itself- Data available in large quantity. But, why its need occurs? Because through advanced research on the available resources the future predictions are possible. Many of the big companies and tech giants are investing in Big Data Engineers. They can manage and maintain critical and huge information daily. But, just we all know, to do this we need some tools and techniques.
What is Apache Spark?
Apache spark is a web framework from Data Bricks. It has been developed for the sole purpose of data management. This is one of the most relevant engines for Big Data. Following are its features:
- Free and open source: It is free to use and developers more than 300 companies contribute to its development.
- Faster and stable: Considering its speed to be 100 times faster than any other engine like Hadoop.
- Simple and powerful: It is simple to us and implement various data analysis techniques.
- Cross-platform: Suits to all operating systems.
- Multiple Language Support: We can use Java, Python, R, Scala and SQL for proprietary use.
- Complex data operations handling: Capable of analyzing most complex data.
- Huge community support: It has world wide developer support.
Alongside it has four major sets of libraries and other third-party libraries:
- SQL and DataFrames.
- Spark Streaming.
- MLib (machine Learning)
- GraphX
Major third-party libraries include additional support from: C#/.NET, Groovy, Kotlin, Julia, and Clojure. The cloud support includes IBM, Amazon AWS, and others. For more info read the documentation from this link.
What is Pyspark?
Pyspark is a famous extension of Apache Spark for Python. It is an open-source library that mainly focuses on:
- Machine Learning
- Proprietary data analysis.
- Data Science
- Big Data with Python and supportive libraries.
Due to the extensive contributions and developer support it has become the most stable and appropriate package for exceptional model building. Models developed under this framework tend to give more accuracy and fast results.
This is more useful as it always gets API support. To know more about it visit this link. We must consider the dependencies before adding them to the system.
System Requirements:
- Python version: Python 3.6 and above.
- Operating System: Windows 7 and above.
- Other library support: Numpy, Pandas, etc.
- A stable internet connection is a must.
How to setup PySpark in Windows?
Follow these steps to install Pyspark to your system:
- Go to https://pypi.org/project/pyspark/ , there you will find the documentation of this project.
- There the link of installation through the pip command is also given.
- Go to the command prompt and type in this command:
pip install pyspark

Note: The default environment is Anaconda, so all libraries through pip also get added to Anaconda only.
Most importantly to confirm that it has been successfully added to our system open any Python IDE and try importing it. If it does not give any error then we are all set to the further journey.

Starting Out With PySpark
We will need a sample dataset to work upon and play with Pyspark. This is the quick start guide and we will cover the basics.
Environment: Anaconda
IDE: Jupyter Notebooks
Dataset used: titanic.csv
The most important thing to create first in Pyspark is a Session. A session is a frame of reference in which our spark application lies. The session we create encapsulates our progress from the start to the final checkpoint. We create it through the spark’s SQL module.
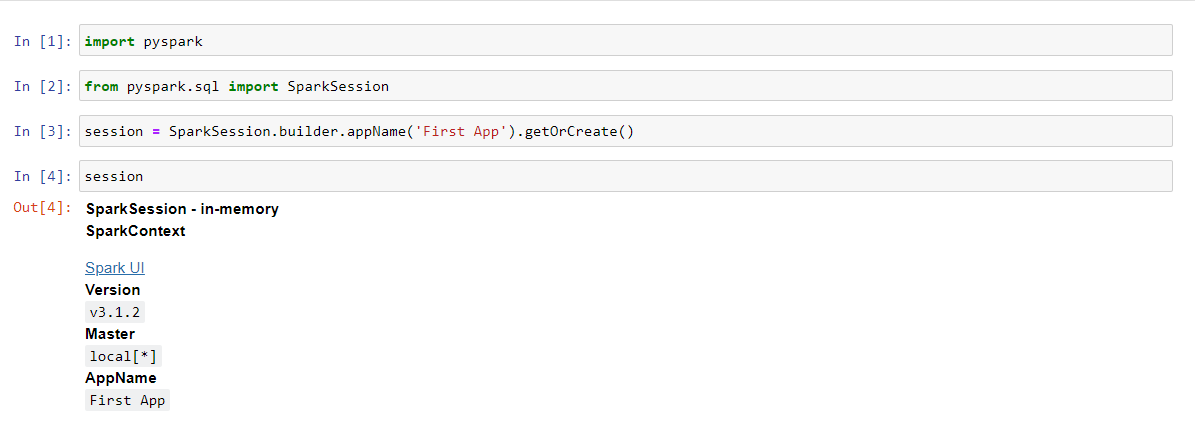
1. Creating a session
Let’s get started with the most basic part of working with PySpark – creating a session. The below code can be used to setup your first session.
Code:
import pyspark # importing the module

from pyspark.sql import SparkSession # importing the SparkSession module
session = SparkSession.builder.appName('First App').getOrCreate() # creating a session

session # calling the session variable
2. Reading a dataset in Spark
When we talk about a dataset, it is a collection of a huge amount of data and records in a row-column format. They can be in thousands or many more.
Specifically, they are an important aspect of a process we call data preprocessing. To predict some output or result we need to preprocess that data, perform extra operations and sentimental analysis. For this Python provides specific modules or libraries.
Generally, we use the Pandas library for this purpose. But, PySpark has its sub-modules that reduce our effort to import the other libraries. Thus, it has read() method. This method has many sub-methods for different file extensions and formats. These are the following:
- csv
- format
- jdbc
- load
- option
- options
- orc
- paraquet
- schema
- table
- text
We are using the titanic datasets with the .csv extension, so we will use the first method.
Code:
data = session.read.csv('Datasets/titanic.csv') # reading the dataset through the given path
data # calling the variable for column created

The session we create is the main approach for this piece of code. Then, the read method and the extension method come in with the dot operator.
To check all the columns and rows in the dataset use the show() method. This will retrieve the first 20 rows if it is too large.
data.show()

Now we can see that the presentation of this dataset is not proper. The column names are not appearing neatly. So, we need to make some changes to it. The read.option() method makes our work easy. This will help us to retrieve the dataset with headers.
Code:
data = session.read.option.('header', 'true').csv('Datasets/titanic.csv')
data
Output:

Now if we check our dataset, then it views like this:

Now that we have our dataset ready let us get some information about its columns. In pandas, we simply use the info() method for this. In Pyspark the printSchema() is the method that reads and gives the values of information concerning each column.
Code:
data.printSchema()

By default, Pyspark reads all the datasets in the form of a string. So, to handle this we need to activate one parameter which is inferSchema. It will read all the major columns along with their respective data types and return the info accordingly.
data = session.readoption('header', 'true').csv('Datasets/titanic.csv', inferSchema = True)

data.printSchema()

3. Data preprocessing
The data preprocessing in Pyspark is quite simple. The library provides us with specific functions to perform such tasks. In this following activities involve.
- Selecting one specific column
- Selecting multiple columns
- Adding a column
- Deleting a column
- Renaming a column
- Dropping the null values
To select one or multiple columns the select() function works perfectly. The syntax is:
dataframe.select(column_name) # selecting one column
dataframe.select(column_1, column_2, .., column_N) # selecting many columns
Output:


To add a column in the dataframe.withColumn() function works for this. It takes two parameters
- New column name to add
- Existing column name to use for (not necessary if the new column has nothing to do with the existing column)
Code:
# adding columns in dataframe
data = data.withColumn('Age_after_3_y', data['Age']+3)
We are adding a column of Age after three years to the dataframe. The Age column taken is an existing one. Through it, we will calculate the age of the passengers three years later.
Output:

As we can see a new column gets added at the end. Its name is: Age_after_3_y.
4. Deleting columns and dropping the null values from the dataset
Deletion in Pyspark is the simplest task we can perform. Because it gives us that much flexibility and adaptability. The drop() function performs the task of removing the column. The syntax for this is simple.
# dropping the columns
dataframe = dataframe.drop('column_name in strings')
dataframe.show()
We will delete the Age_after_3_y column we added previously to the dataset.
Code:
# dropping the columns
data = data.drop('Age_after_3_y')
data.show()

Renaming the column is a bit easier task. The withColunRenamed() function helps us with the same. It takes two parameters
- New name of the column.
- Existing name of the column
To take an example we will change the name of the Fare column in the dataset to Price.
Code:
# renaming the columns
data = data.withColumnRenamed('Fare', 'Price')
data.show()

For dropping the null values we use the na function with the drop() attribute. Generally, it drops all the rows having null values. But, there are two parameters in the function which we can use to drop in a new way:
- how: makes sure to drop values according to the value assigned to. Values are any and all. When how = “any” only the cells having null values drop out but, when how = “all” then the entire row is deleted.
- threshold: takes values in the form of integers. For example: if we set thresh = 2, only two null values are dropped.
- subset: this helps us to choose the specific column of which we need to drop the null values.
Code:
data = data.na.drop(how = 'any', thresh = 2)
data.show()

Thus, we dropped the two null values.
5. Filter operations with Pyspark
Filtering out something is simply retrieving what we need from our dataframe. For example, if we need those persons from the titanic dataset who survived. Filtering is the best option here.
Code:
data = data.filter(data['Survived'] == 1)
data.show()
Output:

So, the data of all those who survived the incident is in front of us.
Conclusion
Thus, in this way, the topic of Pyspark is over. We covered topics like adding spark to our system, data reading, preprocessing, and filtering techniques. This is all about the basic introduction about Pyspark in general.


