🚀 Supercharge your YouTube channel's growth with AI.
Try YTGrowAI FreeUnderstanding P-value in Machine Learning

In this article we will learn about p-value and how it is used to infer the significance in any hypothesis. The null hypothesis is present in all statistical tests. The null hypothesis for the majority of tests is that there is no association between your interest variables or that there is no distinction between groups.
In simple terms, the p value, or probability value, tells you how likely it is that your data could have occurred under the null hypothesis.
What is null hypothesis?
The null hypothesis, often known as H0, is the assertion that there is no relationship or difference between the two sets of data or variables being investigated in a scientific study. Usually a significance test is intended to determine how strong the evidence is against the null hypothesis. With every null hypothesis, there is a alternate hypothesis denoted by Ha. In hypothesis testing, generally we define them as:
To know more in detail about hypothesis testing visit https://www.statisticshowto.com/probability-and-statistics/hypothesis-testing/
- Null Hypothesis: There is no effect or no relationship between variables.
- Alternative Hypothesis: There is effect or relationship in variables.
What is statistical significance?
When we define a hypothesis, we also define a parameter called level of significance( alpha), which is the chance of the study rejecting the null hypothesis, given that the null hypothesis is true. Given that the null hypothesis is correct, p-value is the likelihood of getting a result that is at least as extreme.
- When p < alpha, the result is statistically significant according to the standard studies.
What is p-value and its significance?
In statistics, the p-value is a measure of the evidence against the null hypothesis. It tells us how likely it is to observe a test statistic as extreme or more extreme than the one we observed, assuming that the null hypothesis is true.
A small p-value (less than the significance level, usually 0.05) indicates that the observed result is unlikely to have occurred by chance alone, and therefore provides evidence against the null hypothesis. A large p-value, on the other hand, indicates that the observed result is likely to have occurred by chance, and we cannot reject the null hypothesis.
For example, if we obtain a p-value of 0.05, it means that if we were to repeat the experiment many times under the assumption that the null hypothesis is true, only 5% of the time would we obtain a test statistic as extreme or more extreme than the one we observed. This suggests that there is strong evidence against the null hypothesis, and we can reject it in favor of an alternative hypothesis.
How To Find P-value (significance) In Scikit-learn?
We will first import built-in dataset of diabetes and then we will run a linear regression model on that and calculate p-values for all the variables and also conclude if they statistically significant or not.
Method 1: Using statsmodel library
Importing libraries
The below code uses the statsmodels library in Python to perform an Ordinary Least Squares (OLS) regression analysis on the diabetes dataset. OLS is a method for estimating the unknown parameters in a linear regression model, with the goal of minimizing the sum of the squared differences between the observed and predicted values of the dependent variable.
import numpy as np
from sklearn import datasets
from sklearn.linear_model import LinearRegression
import statsmodels.api as sma
Importing dataset
The diabetes_df dataset is imported from the sklearn library, which contains information about 442 diabetes patients, including age, sex, body mass index (BMI), blood pressure, and six blood serum measurements. The X variable contains the predictor variables, and the y variable contains the target variable.
diabetes_df = datasets.load_diabetes()
X = diabetes_df.data
y = diabetes_df.target
X2  = sma.add_constant(X)
Fitting a Ordinal Least square model to the data
The OLS function is used to fit an OLS model to the data, with the fit() method used to obtain the model coefficients and other summary statistics.
est = sma.OLS(y, X2)
est2 = est.fit()
Getting p-values for each variable
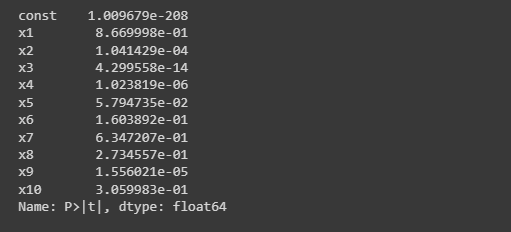
The summary2() method is used to display the p-values for each independent variable, which indicate which variables are statistically significant.
p_values = est2.summary2().tables[1]['P>|t|']
print(p_values)
Below is the output of the above code(p-values)
Method 2: Directly from scikit learn library
In this approach, we will go more mathematically using matrix, but basically to calculate the p-value, you must first understand the distribution of your test statistic under the assumption that the null hypothesis is true. Then, using this distribution’s cumulative distribution function (cdf), we can express the probability of the test statistics being at least as extreme as its value x for the sample:
- Left-tailed test:
p-value = cdf(ts). - Right-tailed test:
p-value = 1 - cdf(ts) - Two-tailed test:
p-value = 2 × min{cdf(ts), 1 - cdf(ts)}
When conducting a t-test, we calculate a test statistic (TS) based on the data we have. We can then use this test statistic to calculate a p-value, which tells us how likely it is to observe such a large (or larger) value of the test statistic if the null hypothesis is true.
To calculate the p-value for a two-sided test, we assume that the distribution of the test statistic under the null hypothesis is symmetric about zero. We then use the observed value of the test statistic (ts) to calculate the p-value as follows:
p-value = 2 * P(TS ≥ |ts| | H0 is true) = 2 * (1 - cdf(|ts|))
Here, P(TS ≥ |ts| | H0 is true) is the probability of observing a test statistic as extreme or more extreme than |ts|, assuming that the null hypothesis is true. The cumulative distribution function (cdf) is a function that tells us the probability of observing a test statistic less than or equal to a certain value. We use the absolute value of the observed test statistic (|ts|) in the calculation because we assume that the distribution is symmetric about zero.
Also read: T-Test Hypothesis in Python
from scipy import stats
model = LinearRegression()
model.fit(X,y)
params = np.append(model.intercept_,model.coef_)
predictions = model.predict(X)

#Modified X
new_X = np.append(np.ones((len(X),1)), X, axis=1)
#Corrected Mean Squared error
M_S_E = (sum((y-predictions)**2))/(len(new_X)-len(new_X[0]))
v_b = M_S_E*(np.linalg.inv(np.dot(new_X.T,new_X)).diagonal())
s_b = np.sqrt(v_b)
t_b = params/ s_b
# two tailed test statistics under symmetric null hypothesis
p_val =[2*(1-stats.t.cdf(np.abs(i),(len(new_X)-len(new_X[0])))) for i in t_b]
p_val = np.round(p_val,3)
p_val
The above code generates p-values for each of vairables as:

Also read: Anova-test-in-python
Summary
By this, we have reached the end of this topic. We have understood the significance of p-value and how to interpret as well implement using different methods in python libraries. Feel free to comment below, in case you come across any question.
References


