K-Means is a very popular clustering technique. The K-means clustering is another class of unsupervised learning algorithms used to find out the clusters of data in a given dataset.
In this article, we will implement the K-Means clustering algorithm from scratch using the Numpy module.
The 5 Steps in K-means Clustering Algorithm
Step 1. Randomly pick k data points as our initial Centroids.
Step 2. Find the distance (Euclidean distance for our purpose) between each data points in our training set with the k centroids.
Step 3. Now assign each data point to the closest centroid according to the distance found.
Step 4. Update centroid location by taking the average of the points in each cluster group.
Step 5. Repeat the Steps 2 to 4 till our centroids don’t change.
We can choose optimal value of K (Number of Clusters) using methods like the The Elbow method.
Implementing the K-Means Clustering Algorithm
Let’s implement the above steps in code now. Import the numpy module and then go through the rest of the code here to get an understanding of how the K-Means clustering is implemented in code.
#Importing required modules

import numpy as np
from scipy.spatial.distance import cdist

#Function to implement steps given in previous section
def kmeans(x,k, no_of_iterations):
    idx = np.random.choice(len(x), k, replace=False)
    #Randomly choosing Centroids
    centroids = x[idx, :] #Step 1

    #finding the distance between centroids and all the data points
    distances = cdist(x, centroids ,'euclidean') #Step 2

    #Centroid with the minimum Distance
    points = np.array([np.argmin(i) for i in distances]) #Step 3

    #Repeating the above steps for a defined number of iterations
    #Step 4
    for _ in range(no_of_iterations):
        centroids = []
        for idx in range(k):
            #Updating Centroids by taking mean of Cluster it belongs to
            temp_cent = x[points==idx].mean(axis=0)
            centroids.append(temp_cent)

        centroids = np.vstack(centroids) #Updated Centroids

        distances = cdist(x, centroids ,'euclidean')
        points = np.array([np.argmin(i) for i in distances])

    return points
The above function return an array of cluster labels for each data point in our training set.
Testing the K-Means Clusters
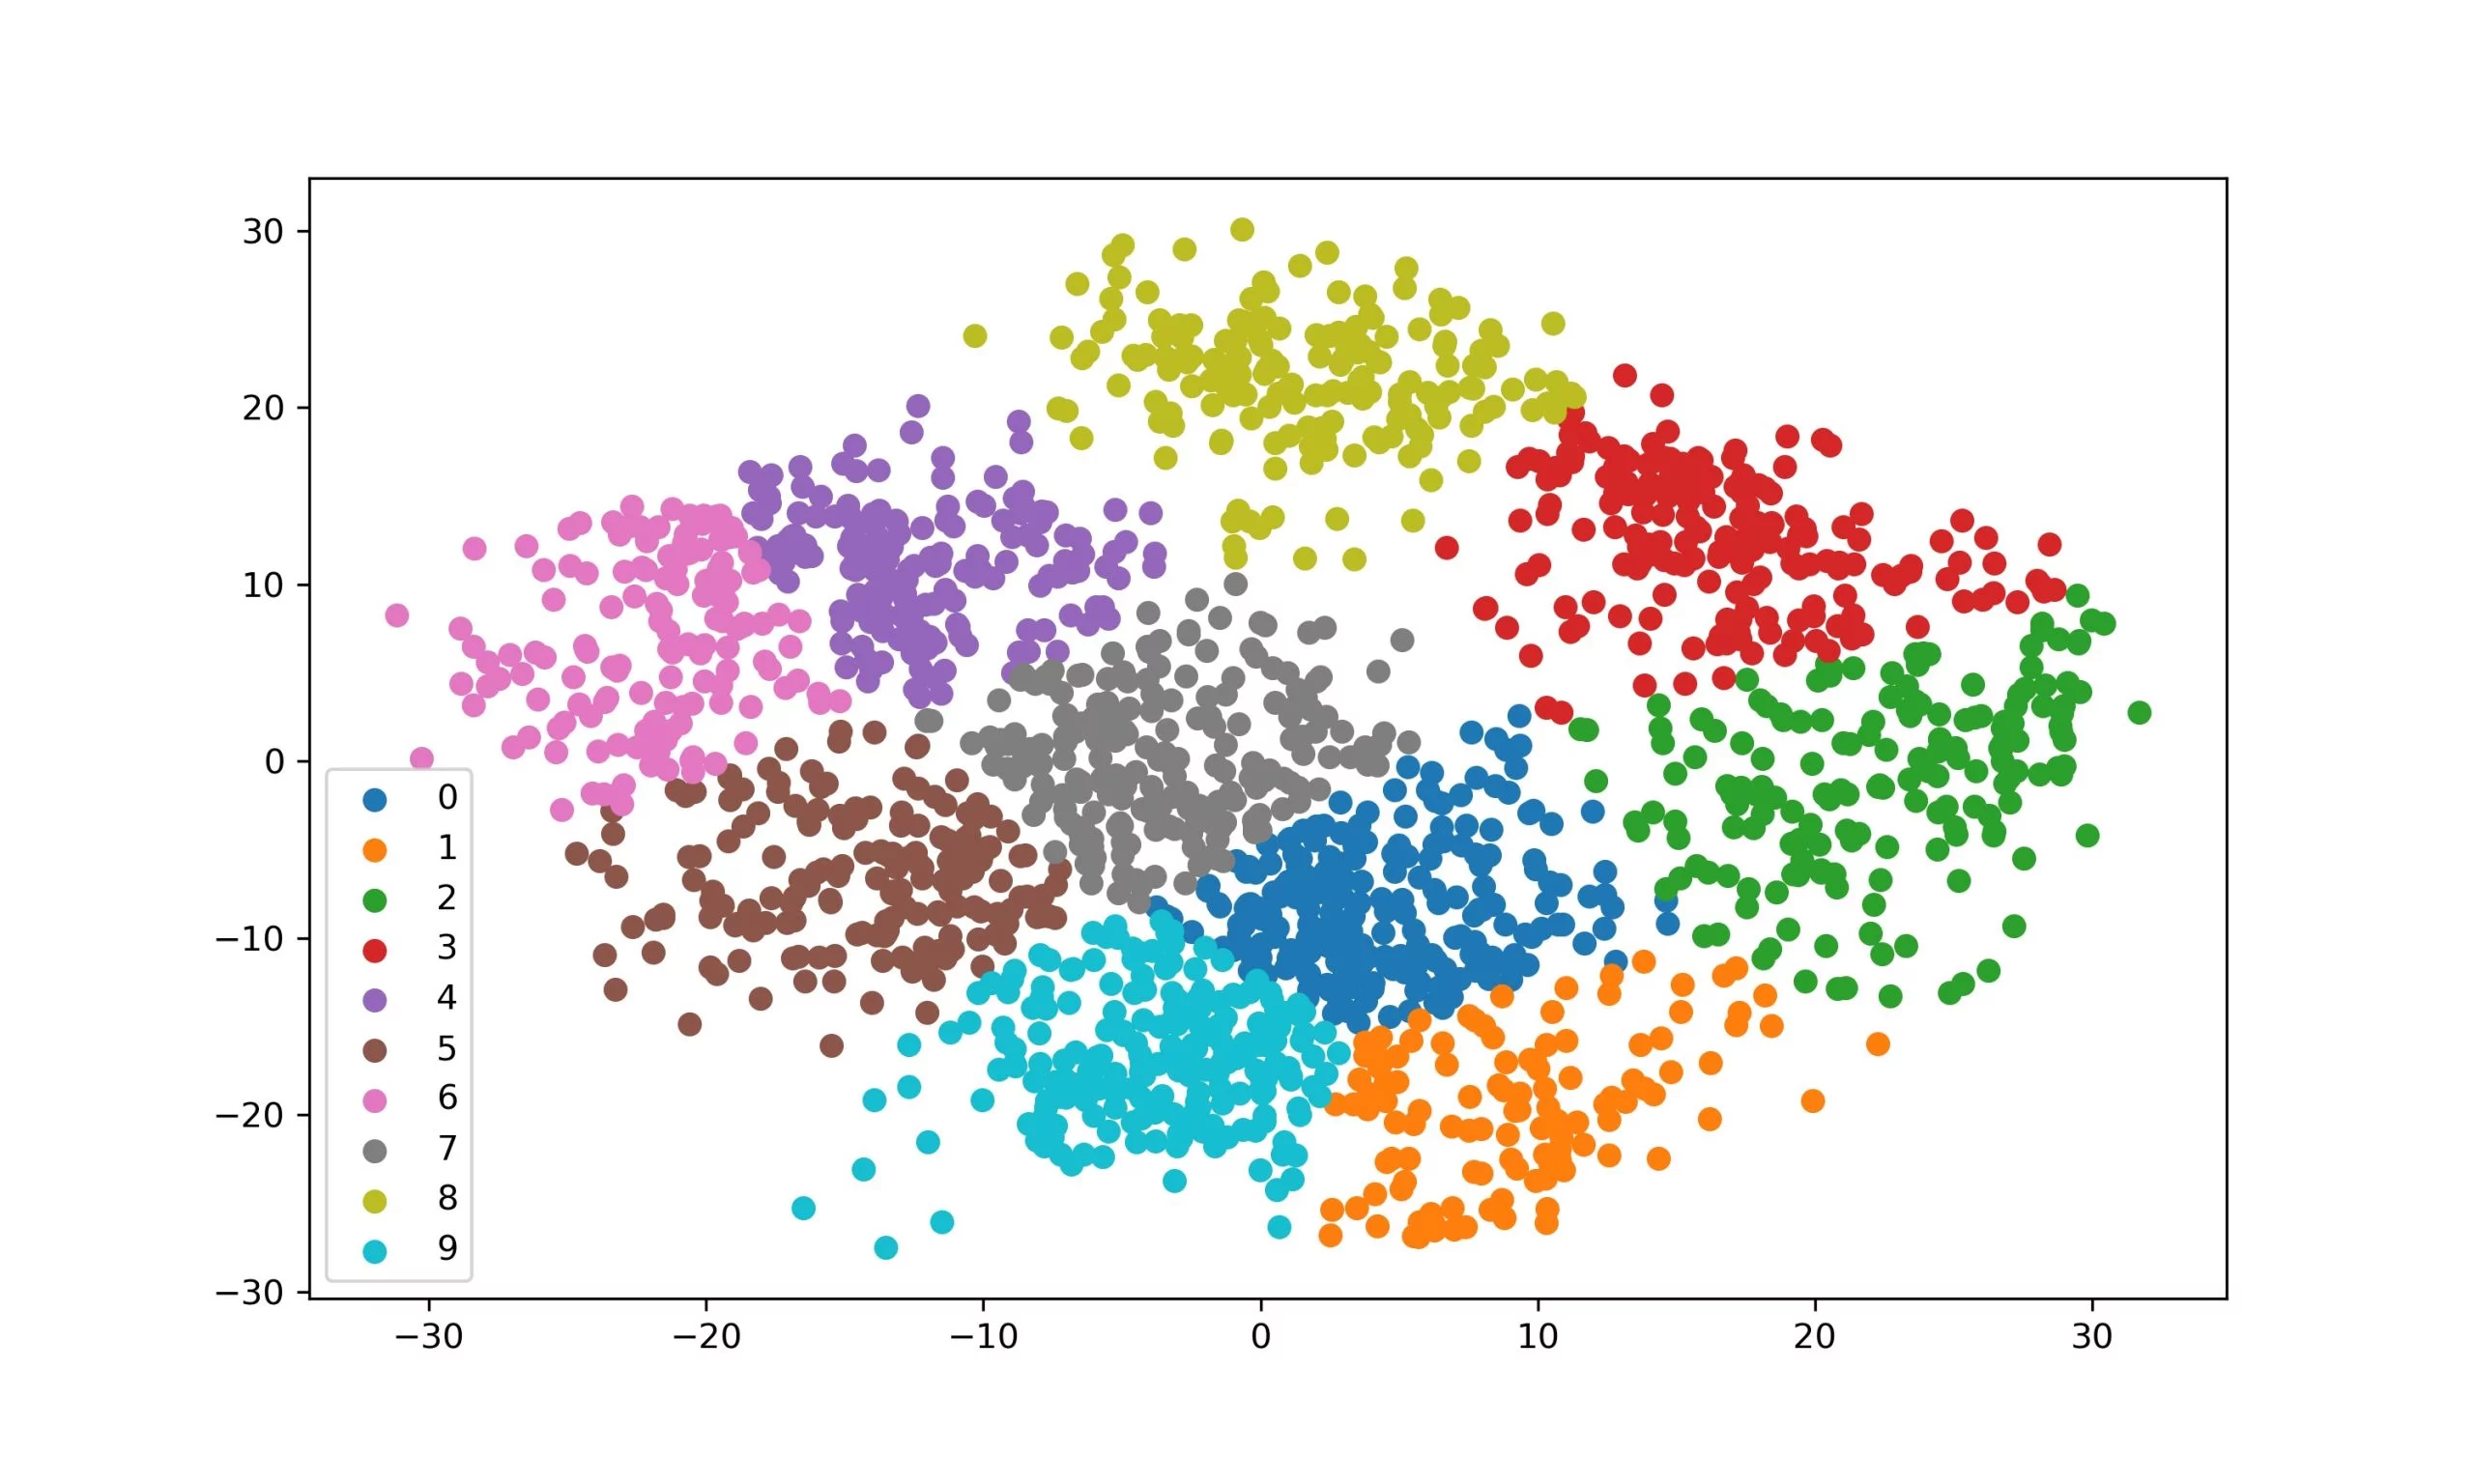
We will use the digits dataset (inbuilt within the sklearn module) for testing our function. You can refer to this article to know more about plotting K-Means Clusters.
#Loading the required modules

import numpy as np
from scipy.spatial.distance import cdist
from sklearn.datasets import load_digits
from sklearn.decomposition import PCA
from sklearn.cluster import KMeans
import matplotlib.pyplot as plt

#Defining our function
def kmeans(x,k, no_of_iterations):
    idx = np.random.choice(len(x), k, replace=False)
    #Randomly choosing Centroids
    centroids = x[idx, :] #Step 1

    #finding the distance between centroids and all the data points
    distances = cdist(x, centroids ,'euclidean') #Step 2

    #Centroid with the minimum Distance
    points = np.array([np.argmin(i) for i in distances]) #Step 3

    #Repeating the above steps for a defined number of iterations
    #Step 4
    for _ in range(no_of_iterations):
        centroids = []
        for idx in range(k):
            #Updating Centroids by taking mean of Cluster it belongs to
            temp_cent = x[points==idx].mean(axis=0)
            centroids.append(temp_cent)

        centroids = np.vstack(centroids) #Updated Centroids

        distances = cdist(x, centroids ,'euclidean')
        points = np.array([np.argmin(i) for i in distances])

    return points


#Load Data
data = load_digits().data
pca = PCA(2)

#Transform the data
df = pca.fit_transform(data)

#Applying our function
label = kmeans(df,10,1000)

#Visualize the results

u_labels = np.unique(label)
for i in u_labels:
    plt.scatter(df[label == i , 0] , df[label == i , 1] , label = i)
plt.legend()
plt.show()

The output results look promising. Our Implementation Works.
Conclusion
In this article, we created a K-Means Clustering Algorithm from scratch using Python. We also covered the steps to make the K-Means algorithm and finally tested our implementation on the Digits dataset. You can read the theory aspects of the K-means clustering algorithm on the Wikipedia page here
Happy Learning
