In this tutorial, we will learn how to create bubble plots in Python using Matplotlib.
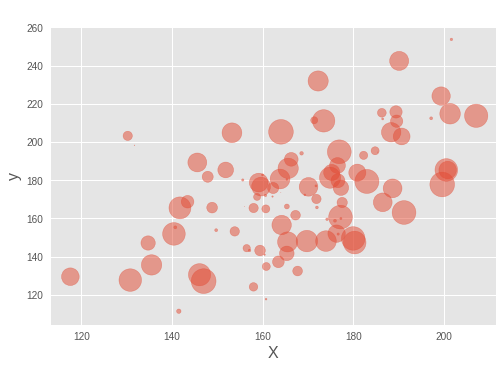
The bubble plot is a scatterplot, but the size of the data points on the scatter plot is coded by a different variable. Essentially, if the third variable is greater, you get a larger circle filled with a color, i.e. a larger bubble, and a smaller bubble for a lower numerical value.
Importing Necessary modules/libraries
import matplotlib.pyplot as plt
import pandas as pd
import numpy as np
Creating Data for Bubble Plots in PYthon
To create bubble plots we will simulate data using the NumPy random function.
We construct an x and y variable for the scatter plot, as well as a third variable for the size of the bubbles in the bubble plot. In Python, we may add a fourth variable to color the bubble plot.
np.random.seed(42)
N = 100
x = np.random.normal(170, 20, N)
y = x + np.random.normal(5, 25, N)
colors = np.random.rand(N)
area = (25 * np.random.rand(N))**2
Let’s put the simulated data into a Pandas data frame. In this example, we create a data frame from NumPy arrays by using Pandas’ DataFrame method and passing the variables as a dictionary.
df = pd.DataFrame({
    'X': x,
    'Y': y,
    'Colors': colors,
    "bubble_size":area})
df.head()

Plotting Bubble Plot
Using Matplotlib and the scatter() method, we can create a bubble plot in Python. To create a bubble plot, we must use the size option “s” to determine the size of the data points.
In our case, s=’bubble size’ is used.
plt.style.use('ggplot')
plt.scatter('X', 'Y', s='bubble_size',alpha=0.5, data=df)
plt.xlabel("X", size=16)
plt.ylabel("y", size=16)

Based on the value of the size variable, we can see that the dots in the scatter plots are now bubbles. Matplotlib colors the bubbles blue by default. We also used alpha=0.5 to provide transparency to the bubbles in the bubble plot.
Get Colored Bubble Plot
Let’s use another variable in the bubble plot to color the bubbles differently. Colors can be specified using the scatter() function’s “c” option. And we use the c=”Colors” option to color the bubble using a variable. Colors is the quantitative variable we defined when we built the data frame.
plt.scatter('X', 'Y',s='bubble_size',c='Colors',alpha=0.5, data=df)
plt.xlabel("X", size=16)
plt.ylabel("y", size=16)

Conclusion
Congratulations! You just learned how to plot a Bubble plot in Python. Hope you enjoyed it! 😇
Liked the tutorial? In any case, I would recommend you to have a look at the tutorials mentioned below:
- Boxplots: Everything you need to know
- Matplotlib Subplots – Plot Multiple Graphs Using Matplotlib
- How to Plot a Treemap in Python?
- How to Plot and Customize a Pie Chart in Python?
Thank you for taking your time out! Hope you learned something new!! 😄


