🚀 Supercharge your YouTube channel's growth with AI.
Try YTGrowAI FreeWeather Data Clustering in Python – A Complete Guide
In this tutorial, we will plan and implement k-means clustering in Python using scikit-learn. Using minute-granularity data, we will apply cluster analysis to construct a large picture model of the weather at a local station.
Introduction to Clustering
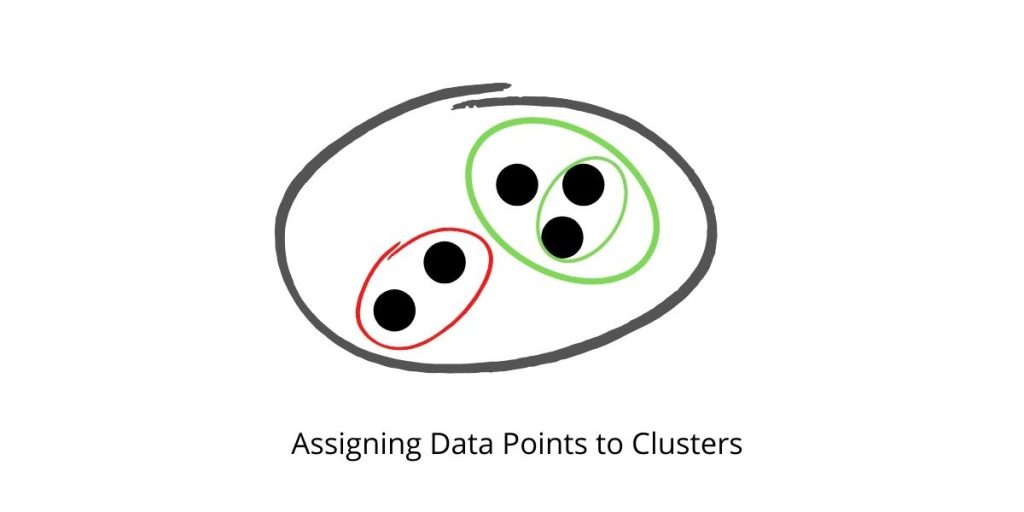
Clustering is the process of separating a population or set of data points into groups so that data points in the same group are more similar to other data points in the same group and different from data points in other groups. It is essentially a collection of items based on their similarity and dissimilarity.
Introduction to K-Means Algorithm
K-Means Clustering is an Unsupervised Learning technique that divides an unlabeled dataset into clusters. In this case, K denotes the number of pre-defined clusters that must be produced during the process; for example, if K=2, there will be two clusters; for K=3, there will be three clusters, and so on.

The Dataset
The minute weather dataset is derived from the same source as the daily weather dataset used in the decision tree-based classifier notebook. The minute weather dataset comprises raw sensor values taken at one-minute intervals, but the hour weather dataset does not. Instead, the daily weather dataset featured processed and well-curated data. The data is stored in the comma-separated file minute weather.csv.
Data was gathered during a three-year period, from September 2011 to September 2014, to ensure that adequate data for all seasons and weather conditions was obtained.
Each row in minute weather.csv provides one-minute interval weather data.
Implementing Weather Data Clustering in Python
Let’s get our hands dirty and hop onto the coding. We’ll go step by step while making it really simple for you to start with.
Importing the Necessary Libraries
from sklearn.preprocessing import StandardScaler
from sklearn.cluster import KMeans
import pandas as pd
import numpy as np
from itertools import cycle, islice
import matplotlib.pyplot as plt
from pandas.plotting import parallel_coordinates
plt.style.use('seaborn')

%matplotlib inline
Loading the Dataset
D = pd.read_csv('minute_weather.csv')
D.head()

Data Sampling
Data sampling is a statistical analysis approach that selects, manipulates, and analyses a representative selection of data points in order to find patterns and trends in the broader data set under consideration.
#Taking every 10th row

sampled_df = D[(D['rowID'] % 10) == 0]
sampled_df.shape
Drop all the Rows with empty values
del sampled_df['rain_accumulation']
del sampled_df['rain_duration']

B = sampled_df.shape[0]
sampled_df = sampled_df.dropna()
A = sampled_df.shape[0]

print("No of rows deleted: ", B-A)
We noticed that a total of 46 rows got deleted after dropping the empty and NaN values.
Select Features of Interest for Clustering
features = ['air_pressure', 'air_temp', 'avg_wind_direction', 'avg_wind_speed', 'max_wind_direction', 'max_wind_speed','relative_humidity']
select_df = sampled_df[features]
You can choose some other features as per your interest. That’s totally up to your preferences.
Scale the Features using StandardScaler
The main idea is to normalize/standardize i.e. μ = 0 and σ = 1 your features which are present in the dataset, individually, before applying any machine learning model.
X = StandardScaler().fit_transform(select_df)
Applying K-Means Clustering
KM = KMeans(n_clusters=10)
model = KM.fit(X)
centers = model.cluster_centers_
The function cluster_centers_ function will collect all the central points of all the 10 clusters formed.
Data Visualization
# 1. Function that generates a DataFrame with a Cluster Number column.

def pd_centers(featuresUsed, centers):
	colNames = list(featuresUsed)
	colNames.append('prediction')
	Z = [np.append(A, index) for index, A in enumerate(centers)]
	P = pd.DataFrame(Z, columns=colNames)
	P['prediction'] = P['prediction'].astype(int)
	return P

# 2. Function that creates Parallel Plots

def parallel_plot(data):
	my_colors = list(islice(cycle(['b', 'r', 'g', 'y', 'k']), None, len(data)))
	plt.figure(figsize=(15,8)).gca().axes.set_ylim([-3,+3])
	parallel_coordinates(data, 'prediction', color = my_colors, marker='o')

P = pd_centers(features, centers)
Visualizing Warm Days
parallel_plot(P[P['air_temp'] > 0.5])

Visualizing Dry Days
parallel_plot(P[P['relative_humidity'] < -0.5])

Conclusion
Congratulations! You just learned how to cluster weather data using KMeans Algorithm. Hope you enjoyed it! 😇
Liked the tutorial? In any case, I would recommend you to have a look at the tutorials mentioned below:
- K-Means Clustering From Scratch in Python [Algorithm Explained]
- How to Plot K-Means Clusters with Python?
- Hierarchical Clustering with Python
Thank you for taking your time out! Hope you learned something new!! 😄


