MATLAB, an abbreviation for MATrix LABoratory, developed by MathWorks, is a high-performance programming language. It is mainly popular among scientists and engineers for its multi-paradigm functionality. Meaning, it can be used for many tasks involving Visual, Functional, and Object-Oriented. All the programs are saved with a .m extension.
Although not free to use, their product can be accessed through free trials and most of the institutions provide MATLAB to students for free! Given its widespread applications and vast community, one should totally give it a try!
For all the data and machine learning enthusiasts wondering – YES, we can use MATLAB for machine learning and data analysis tasks. MATLAB offers a wide range of libraries and pre-defined functions to support machine learning, programming, deep learning, and data analysis. The best feature? MATLAB can be integrated with Python!
Also check: Data Analysis in Python here
Now let’s focus on finding the Python equivalent of MATLAB’s Hold On command.
What Is MATLAB Used For?
You must have understood by the introduction that MATLAB is versatile and can be used for many tasks. Be it engineering, scientific, app development, control systems, or deep learning, MATLAB has it all.
But we are focused on one specific task today. Which is, plotting different points or functions on a single grid.
Let us see an example of plotting the sine function in MATLAB.
x = linspace(0, 2*pi, 100);
y = sin(x);
plot(x, y);
xlabel('x');
ylabel('sin(x)');
That is the MATLAB code we use to create a sin graph for 100 points using the linspace method.
The linspace method of MATLAB works similarly to the numpy linspace method, which creates linearly spaced points. The linspace function generates 100 points stored in variable x.
In the next line, we are trying to plot a sin function for these points. This function is stored in a variable called y.
The plot function is used to display the sin graph of the variables. The labels of the x and y axes are specified in the last two lines.

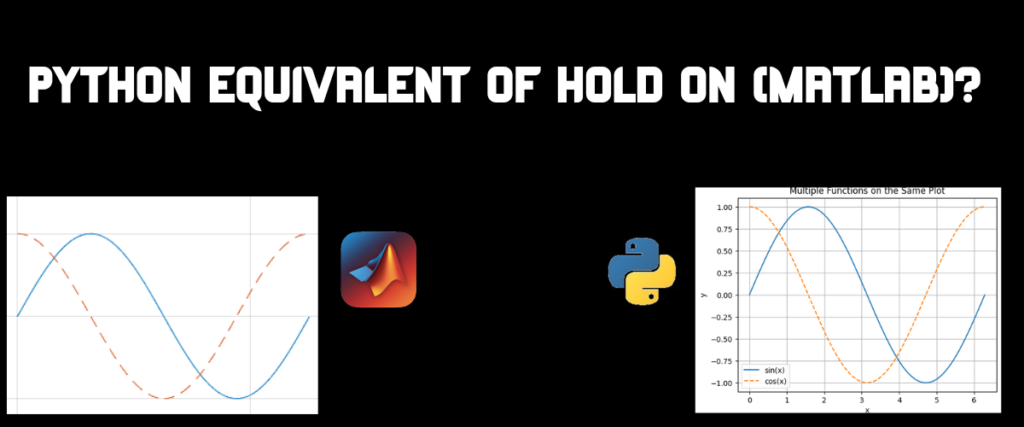
Now, you also want to plot the cosine and tangent functions of the same points and think well, now I have to plot them in three different graphs. MATLAB has a command that can be used to plot multiple graphs on the same grid. Which is the Hold On command.
To plot multiple graphs on a single grid in Python as an equivalent to MATLAB’s Hold On command, you can use the Matplotlib library. Import Matplotlib and define your data points. Then use plt.plot() for each graph you want to plot. At the end, call plt.show() once after all plot calls. This will display all the graphs on a single grid.
MATLAB Hold On Command
The ‘Hold On‘ command in MATLAB allows you to plot multiple graphs on a single grid by holding the current plot open for additional plots.
Let us see an example.
x = linspace(0, 2*pi, 100);
y1 = sin(x);
y2 = cos(x);
y3 = tan(x);
plot(x, y1,'g');
hold on;
plot(x, y2, 'r');
hold on;
plot(x,y3,'b');
title('Multiple Functions on the Same Plot');
xlabel('x');
ylabel('y');
legend('sin(x)', 'cos(x)', 'tan(x)');
hold off;
In addition to the sin function, we also added the cos and tan functions which are saved using y1,y2, and y3. We call the plot function three times to plot each function once. Between these calls, we find something called hold on. This command is used to wait for other plots to be displayed on a single grid. The graph also consists of the title of the graph, legend, and labels.

Python Equivalent of Hold On
Plotting multiple graphs on the same plot is really simple with the matplotlib library. We don’t have to use any command to achieve the same functionality here with Python.
Refer to the Matplotlib tutorial
To know the trick, we need to know about two methods of the matplotlib library. The plot() method is used to create the plots. To describe the method in one line, it is the visual representation of the code we write.
The show() method is used to display the visual plots created by the plot function. It is the last step in creating plots or graphs with matplotlib.
Actually, there is no trick; we just need to call the plt.show() method after we call the plot function for every plot.
To better comprehend, let us call the plot function to create a plot for the tangent at the end, after the plt.show().
import numpy as np
import matplotlib.pyplot as plt
x = np.linspace(0, 2*np.pi, 100)
y1 = np.sin(x)
y2 = np.cos(x)
y3=np.tan(x)
plt.plot(x, y1, 'g',label='sin(x)')
plt.plot(x, y2, 'r', label='cos(x)')
plt.xlabel('x')
plt.ylabel('y')
plt.legend()
plt.show()
plt.plot(x,y3,'b', label='tan(x)')
Remember how we generated 100 points using linspace in MATLAB? We follow the same principle here. The plot functions are used to create the plots for sin and cos before calling the show function. The plot method for tangent is called right after the show method.
Wondering what output we get?

Now…what if we call all the plt.plot functions before the plt.show?
import numpy as np
import matplotlib.pyplot as plt
x = np.linspace(0, 2*np.pi, 100)
y1 = np.sin(x)
y2 = np.cos(x)
y3=np.tan(x)
plt.plot(x, y1, 'g',label='sin(x)')
plt.plot(x, y2, 'r', label='cos(x)')
plt.plot(x,y3,'b', label='tan(x)')
plt.xlabel('Angle in Radians');
plt.ylabel('Function Value')
plt.legend(['sin(x)', 'cos(x)', 'tan(x)'])
plt.show()
All we changed here is the place of the plot function for tangent.

Summary
To conclude, we have seen two ways to plot multiple graphs on the same plot with MATLAB-using a command and Python – well, no command and just a simple trick.
We can even visualize different types of graphs like line plots, bars and so on using MATLAB and there must be a Pythonic way to achieve the same. Why limit yourself to one graph when you can display multiple? Are you ready to unlock the full potential of your data visualization?
