🚀 Supercharge your YouTube channel's growth with AI.
Try YTGrowAI FreeInterpolation of a 3D Volume With Numpy and Scipy
Interpolation is a bit complex topic to understand. But to put it in simple words, interpolation refers to the process of finding new points between the given points by using the known data points or values as reference.
Interpolation is a technique with which you can estimate unknown data points between two known data points. It is commonly used to fill in missing values in a table or a dataset using already-known values.
Suppose you are given two points and are asked to find n number of points between these two points. There are different ways to deal with this issue; one simple approach to this problem is to measure the distance between these two points and find a new point exactly in the middle of the given data points. Let us name the given points A and B. The new point you just found can be named C. Now you have a new data point. You can even extend this process further and find more points by repeating the same process between A and C, C and B.
Interpolation is a technique used to find missing values between the given points. This process is simple if you have got only one point or at most two points. How can you interpolate a set of three points or more?
We have all the necessary functions to interpolate an N-dimensional object in a Python library called scipy. Scipy stands for Scientific Python and is built on top of the Numpy library. Justifying its name, scipy is used to perform many scientific operations like interpolation, signal and image processing, and much more. It has more advanced features as compared to numpy.
We have come to know that interpolation is used to fill the missing gaps or values of a function or in between the given points. Interpolation finds its applications in fields like computer graphics, image processing, and data analysis. While expanding an image you can estimate the pixel value for a new pixel using the neighboring pixels.
Refer to this article to know how to interpolate 1D space using Numpy.
Interpolation of a 3D Volume With Scipy
For this article, we are going to try to interpolate a 3D space using different types of interpolations available in the SciPy library.
As we discussed, the scipy library has additional features that are used for more advanced scientific calculations.
To start off, refer to this tutorial on SciPy.
The interpolate sub-class of the scipy library is what we are gonna need to perform the interpolation. There are several interpolators, but we are going to focus on three main interpolators in this post.
Interpolate 3D Volume With Linear Interpolator
The linear interpolator finds the missing values between any number of given data points based on a straight-line approximation, more or less like how we discussed interpolation in the beginning.
The linear interpolator is available in the interpolate package of the scipy library as LinearNDInterpolator.
Let us see the code.
import numpy as np
from scipy.interpolate import LinearNDInterpolator
x = np.linspace(0, 1, num=10)
y = np.linspace(1, 2, num=10)
z = np.linspace(2, 3, num=10)
X, Y, Z = np.meshgrid(x, y, z)
values = np.random.rand(10, 10, 10)
x1 = np.linspace(0, 1, num=20)
y1 = np.linspace(1,2, num=20)
z1= np.linspace(2,3, num=20)
X1,Y1,Z1= np.meshgrid(x1,y1,z1)
points = np.column_stack((X.flatten(), Y.flatten(), Z.flatten()))
values_flat = values.flatten()
interfunc = LinearNDInterpolator(points, values_flat)
interpolated_values = interfunc(np.column_stack((X1.flatten(), Y1.flatten(), Z1.flatten())))
interpolated_values = interpolated_values.reshape(X1.shape)
print("The original values are:")
print(f"x: {x},\n y: {y},\n z: {z}\n")
print("The interpolated values:")
print(interpolated_values)
In the first two lines, we are importing the numpy library for creating the 3D space and the LinearNDInterpolator for interpolating.
The next three lines create three arrays x,y, and z which contain values 10 between 0 and 1, 1 and 2, and 2 and 3 respectively.
These arrays are used to create a grid of points using the meshgrid method of the numpy library. Then we are creating another set of arrays that contain the values to interpolate.
In the following lines, we are flattening the arrays and then arranging them in a grid fashion. The flattened values are stored in the values_flat variable. The interfunc is the variable that performs the linear interpolation.
Lastly, we are printing the original values and the interpolated values.

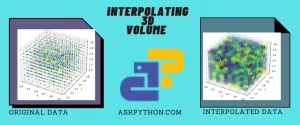
From this output full of numbers, we can just understand that we have created a set of new interpolated values. What if there is a way to visualize the 3d volume before and after the interpolation?
We can visualize the 3d grid we just created using the matlpotlib library. Let us see the code for it.
import matplotlib.pyplot as plt
from mpl_toolkits.mplot3d import Axes3D
# original data
fig = plt.figure(figsize=(9,4))
ax1 = fig.add_subplot(121, projection='3d')
ax1.set_title("Original Data")
ax1.scatter(X, Y, Z, c=values, cmap='viridis')
ax1.set_xlabel('X')
ax1.set_ylabel('Y')
ax1.set_zlabel('Z')
#interpolated data
ax2 = fig.add_subplot(122, projection='3d')
ax2.set_title("Interpolated Data(Linear)")
ax2.scatter(X1,Y1,Z1, c=interpolated_values, cmap='viridis')
ax2.set_xlabel('X')
ax2.set_ylabel('Y')
ax2.set_zlabel('Z')
plt.tight_layout()
plt.show()
The first two lines import the necessary libraries for visualizing the 3D grid. In this code, we are creating two sub-plots so that the original data and the interpolated data grids appear side by side.
The ax1 is the plot for the original data and the number 121 means this grid will be plotted across one row and two columns and will appear first. The projection is set to 3D. The color map we chose for the scatter plot is viridis which consists of colors that look the same in the original and grayscale. You can go for any color map of your choice. The title and labels for the plot are set and the same process is repeated for the interpolated data grid.
The tight _layout method is used to prevent overlapping between the two grids and the show method is used to display the plot.

As you can see in the original data, there are many void spaces. All these spaces are filled with values in the interpolated data.
Interpolation provides a set of estimated values that can fill the gaps in the original data. So what you are seeing in the interpolated data grid are the estimated values that can probably fill the gaps in the original data.
We are going to follow the same process for the next two interpolators and at last, we are going to compare the interpolation results of the three types.
Interpolate 3D Volume With Regular Grid Interpolator
This interpolator is used to work with data in the form of a grid. The regular grid interpolator of the scipy library is suitable for higher dimensional data and can estimate the new values better compared to the previous interpolator.
There are not many changes to the code we used previously. We just need to change the name of the interpolator.
import numpy as np
from scipy.interpolate import RegularGridInterpolator
import matplotlib.pyplot as plt
from mpl_toolkits.mplot3d import Axes3D
x = np.linspace(0, 1, num=10)
y = np.linspace(1, 2, num=10)
z = np.linspace(2, 3, num=10)
X, Y, Z = np.meshgrid(x, y, z)
values = np.random.rand(10, 10, 10)
x1 = np.linspace(0, 1, num=20)
y1 = np.linspace(1,2, num=20)
z1= np.linspace(2,3, num=20)
X1,Y1,Z1= np.meshgrid(x1,y1,z1)
points = np.column_stack((X.flatten(), Y.flatten(), Z.flatten()))
values_flat = values.flatten()
interp_func = LinearNDInterpolator(points, values_flat)
interpolated_values = interp_func(np.column_stack((X1.flatten(), Y1.flatten(), Z1.flatten())))
interpolated_values = interpolated_values.reshape(X1.shape)
print("The original values are:")
print(f"x: {x},\n y: {y},\n z: {z}\n")
print("The interpolated values:")
print(interpolated_values)
Let us see the interpolated values.

If you compare the values generated by the two interpolators, they are slightly different. So each of the interpolators estimates the values differently.
Let us visualize these values.
# Plot original data
fig = plt.figure(figsize=(10, 5))
ax1 = fig.add_subplot(121, projection='3d')
ax1.set_title("Original Data")
ax1.scatter(X, Y, Z, c=values, cmap='viridis')
ax1.set_xlabel('X')
ax1.set_ylabel('Y')
ax1.set_zlabel('Z')
# Plot interpolated data
ax2 = fig.add_subplot(122, projection='3d')
ax2.set_title("Interpolated Data(Regular)")
ax2.scatter(X1,Y1,Z1, c=interpolated_values, cmap='viridis')
ax2.set_xlabel('X')
ax2.set_ylabel('Y')
ax2.set_zlabel('Z')
plt.tight_layout()
plt.show()
The output is given below.

Interpolate 3D Volume With Nearest Neighbor Interpolator
According to the scipy documentation, the nearest neighbor interpolator is the best one for 3-dimensional data. Let us see the results of this one.
import numpy as np
from scipy.interpolate import NearestNDInterpolator
import matplotlib.pyplot as plt
from mpl_toolkits.mplot3d import Axes3D
import numpy as np
from scipy.interpolate import LinearNDInterpolator
import matplotlib.pyplot as plt
from mpl_toolkits.mplot3d import Axes3D
x = np.linspace(0, 1, num=10)
y = np.linspace(1, 2, num=10)
z = np.linspace(2, 3, num=10)
X, Y, Z = np.meshgrid(x, y, z)
values = np.random.rand(10, 10, 10)
x1 = np.linspace(0, 1, num=20)
y1 = np.linspace(1,2, num=20)
z1= np.linspace(2,3, num=20)
X2,Y2,Z2= np.meshgrid(x1,y1,z1)
points = np.column_stack((X.flatten(), Y.flatten(), Z.flatten()))
values_flat = values.flatten()
interp_func = LinearNDInterpolator(points, values_flat)
interpolated_values = interp_func(np.column_stack((X2.flatten(), Y2.flatten(), Z2.flatten())))
interpolated_values = interpolated_values.reshape(X2.shape)
print("The original values are:")
print(f"x: {x},\n y: {y},\n z: {z}\n")
print("The interpolated values:")
print(interpolated_values)

Now let us visualize the original data and the interpolated data.
# Plot original data
fig = plt.figure(figsize=(10, 5))
ax1 = fig.add_subplot(121, projection='3d')
ax1.set_title("Original Data")
ax1.scatter(X, Y, Z, c=values, cmap='viridis')
ax1.set_xlabel('X')
ax1.set_ylabel('Y')
ax1.set_zlabel('Z')
# Plot interpolated data
ax2 = fig.add_subplot(122, projection='3d')
ax2.set_title("Interpolated Data(Nearest Neighbor)")
ax2.scatter(X2,Y2,Z2, c=interpolated_values, cmap='viridis')
ax2.set_xlabel('X')
ax2.set_ylabel('Y')
ax2.set_zlabel('Z')
plt.tight_layout()
plt.show()

There is one more thing left to do. Although the results look somewhat similar, they are a bit different. Let us compare the results in a bigger scale.
import numpy as np
from scipy.interpolate import NearestNDInterpolator, LinearNDInterpolator, RegularGridInterpolator
import matplotlib.pyplot as plt
from mpl_toolkits.mplot3d import Axes3D
x = np.linspace(0, 1, num=10)
y = np.linspace(1,2, num=10)
z = np.linspace(2,3, num=10)
X, Y, Z = np.meshgrid(x, y, z)
values = np.random.rand(10, 10, 10)
new_x = np.linspace(0, 1, num=20)
new_y = np.linspace(1,2, num=20)
new_z = np.linspace(2,3, num=20)
new_X, new_Y, new_Z = np.meshgrid(new_x, new_y, new_z)
points = np.column_stack((X.flatten(), Y.flatten(), Z.flatten()))
values_flat = values.flatten()
nearest_interp_func = NearestNDInterpolator(points, values_flat)
nearest_interpolated_values = nearest_interp_func(np.column_stack((new_X.flatten(), new_Y.flatten(), new_Z.flatten())))
nearest_interpolated_values = nearest_interpolated_values.reshape(new_X.shape)
linear_interp_func = LinearNDInterpolator(points, values_flat)
linear_interpolated_values = linear_interp_func(np.column_stack((new_X.flatten(), new_Y.flatten(), new_Z.flatten())))
linear_interpolated_values = linear_interpolated_values.reshape(new_X.shape)
interp_func = RegularGridInterpolator((x, y, z), values)
regular_interpolated_values = interp_func((new_X, new_Y, new_Z))
fig = plt.figure(figsize=(15, 5))
ax1 = fig.add_subplot(131, projection='3d')
ax1.set_title("Interpolated Data (Nearest Neighbor)")
ax1.scatter(new_X, new_Y, new_Z, c=nearest_interpolated_values, cmap='viridis')
ax1.set_xlabel('X')
ax1.set_ylabel('Y')
ax1.set_zlabel('Z')
ax2 = fig.add_subplot(132, projection='3d')
ax2.set_title("Interpolated Data (Linear)")
ax2.scatter(new_X, new_Y, new_Z, c=linear_interpolated_values, cmap='viridis')
ax2.set_xlabel('X')
ax2.set_ylabel('Y')
ax2.set_zlabel('Z')
ax3 = fig.add_subplot(133, projection='3d')
ax3.set_title("Interpolated Data (Regular Grid)")
ax3.scatter(new_X, new_Y, new_Z, c=regular_interpolated_values, cmap='viridis')
ax3.set_xlabel('X')
ax3.set_ylabel('Y')
ax3.set_zlabel('Z')
plt.tight_layout()
plt.show()

We can observe from the output that the result is a bit dense in the case of the nearest neighbor interpolation and it is finer in the case of the other two.
Conclusion
To conclude we have learned about interpolation in detail. Interpolation is a technique with which you can estimate unknown data points between two known data points. It is commonly used to fill in missing values in a table or a dataset using already-known values. This technique provides a set of estimated values that can probably fill the gaps of an object or a function.
The scipy library of Python is a more advanced version of Numpy helping us to perform complex scientific tasks like integration and interpolation. In this tutorial, we have used the three main interpolators of the scipy library- Linear interpolator, Regular Grid interpolator, and Nearest Neighbor Interpolator to interpolate a 3D volume. We have plotted the results and compared them. The nearest neighbor interpolator provides a dense interpolation compared to the others.
References
Refer to the official documentation of the scipy library here.
For more visualization concepts, visit the official documentation of Matplotlib.