🚀 Supercharge your YouTube channel's growth with AI.
Try YTGrowAI FreeCreating Weighted Graph from a Pandas DataFrame

Hey folks! In this tutorial, we will understand how to build our own weighted graph from the Pandas data frame.
Create A Weighted Graph From a Pandas Dataframe
The first task in any python program is importing necessary modules/libraries into the code.
import pandas as pd
import numpy as np
import networkx as nx
import matplotlib.pyplot as plt
The next task is to create a data frame for which the graph needs to be plotted in the later sections. The same can be obtained with the help of the pandas and numpy module.
First, we create a random seed that will help is generate some random integers in a particular range which will be taken as weights of the edges in the later section. Next, the data frame is created using the DataFrame function and pass the data for the graph to the function.
r = np.random.RandomState(seed=5)
weights = r.random_integers(1, 5, size=(5,))
df = pd.DataFrame({'from':['A','B','C','D','E'],'to':['D','E','A','D','C'],'weight':weights})
df.head()

Next, we will try to visualize the weight added plot by plotting the nodes, edges, and labels separately with the help of draw_networkx_nodes , draw_networkx_edges and draw_networkx_labels function respectively.
Visualizing Nodes
fig, ax = plt.subplots()
pos = nx.spring_layout(G)
plt.title("Plotting Nodes")
nx.draw_networkx_nodes(G, pos, ax = ax)

Visualizing Edges
fig, ax = plt.subplots()
pos = nx.spring_layout(G)
plt.title("Plotting Edges")
nx.draw_networkx_edges(G, pos, width=durations, ax=ax)

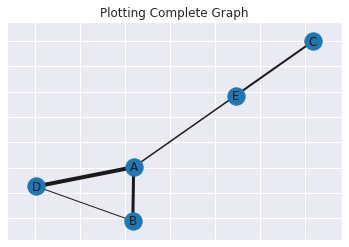
Visualizing The Complete Graph
fig, ax = plt.subplots()
pos = nx.spring_layout(G)
plt.title("Plotting Complete Graph")
nx.draw_networkx_nodes(G, pos, ax = ax)
nx.draw_networkx_edges(G, pos, width=durations, ax=ax)
_ = nx.draw_networkx_labels(G, pos, labels, ax=ax)
Conclusion
Congratulations! You just learned how to build a graph using pandas data frame in the NetworkX library. Hope you enjoyed it! 😇
Liked the tutorial? I would recommend you to have a look at the tutorials mentioned below:
- NetworkX Package – Python Graph Library
- Calculating the Distance Between Nodes in an Unweighted Graph
- Graph Operations in Python [With Easy Examples]
- Implementing a Graph in Python
Thank you for taking your time out! Hope you learned something new!! 😄


