🚀 Supercharge your YouTube channel's growth with AI.
Try YTGrowAI FreeIntroduction to Frequency Tables in Python

A table that depicts the frequency of occurrences of several categories is called a frequency table. This particular kind of table is especially helpful for gaining an idea of the distribution of the values contained in a dataset. This tutorial will walk you through the process of creating frequency tables in Python. We will be covering implement of the same in a number of different ways which are covered in the next few sections.
Also Read: 6 Ways to Count Pandas Dataframe Rows
Method 1 – With the help of value_counts() function
The very first method is to make use of the value_counts() function which will return a series containing the count of unique values in all the list of values. The result will be in descending order which implies that the first element is the most frequently-occurring element.
import pandas as pd

data = pd.Series([1, 2, 5, 2, 3, 3, 3, 3, 4, 4, 5])

print("The Dataset is : ")
print(data)

print("\nFrequency Table for the data : ")
print(data.value_counts())
The Dataset is :
0     1
1     2
2     5
3     2
4     3
5     3
6     3
7     3
8     4
9     4
10    5
dtype: int64

Frequency Table for the data :
3    4
2    2
5    2
4    2
1    1
Method 2 – With the help of crosstab() function
Another function that we can use to display frequencies of a pandas DataFrame is the crosstab() function as shown in the code below. We will create a dataframe and then create the frequency table for two columns of the data frame.
df = pd.DataFrame({'Student_Grade': ['A','B','A','B','B', 'B', 'B', 'C', 'C', 'D'],
                   'Student_Age': [18, 25, 28, 19, 30, 20, 15, 18, 29, 17],
                   'Student_Gender': ['M','F', 'M', 'F', 'F', 'M', 'M', 'F', 'F', 'F']})

print("The Dataset is : ")
print(df)

print("\nFrequency Table for the Grade in the dataset : ")
pd.crosstab(index=df['Student_Grade'], columns='count')

print("\nFrequency Table for the Gender in the dataset : ")
pd.crosstab(index=df['Student_Gender'], columns='count')

Advance Frequency Tables ( 2 – way Tables )
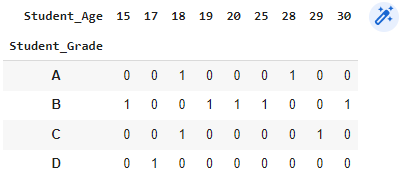
We can also create a two-way frequency table to display the frequencies for two different columns in the dataset we used in the last section. The following code displays a two-way frequency table for the two columns Age and Grade.
pd.crosstab(index=df['Student_Grade'], columns=df['Student_Age'])
We will also be developing a two-way frequency table between the two columns Gender and Grade. Look at the code below.
pd.crosstab(index=df['Student_Grade'], columns=df['Student_Gender'])

Thank you for reading! I hope you understood the tutorial 😃
I would recommend you to give the following tutorials a read as well:
- Calculating Precision in Python — Classification Error Metric
- Chi-square test in Python — All you need to know!!
- Universal NumPy Trigonometric functions to know


