🚀 Supercharge your YouTube channel's growth with AI.
Try YTGrowAI FreeUnderstanding Confusion Matrix in Python

Hey, folks! Today we will be having a look at one of the most important concepts of Data Science – Confusion Matrix and its Implementation in Python.
Data science is a huge domain wherein we study the data, clean the data and perform predictions using various Machine Learning algorithms. After having used any algorithm, it is very important for us to check the accuracy and effect of the algorithm towards the contribution of a desired output.
One such Error metric to evaluate the performance of a model is Confusion Matrix.
What is the Confusion Matrix?
At times, we come across situations wherein we need to apply certain ML algorithms to predict outcome for classification problem i.e. business problems wherein the outcome/target/response variable is a categorical data. Example: To detect whether an email is SPAM or NOT-SPAM.
So, in the above scenario, we need a special Error Metric to judge the accuracy and exactness of the model for a best fit.
Confusion Matrix is an Error Metric, that is used to judge the performance of Classification Machine Learning Algorithms. It provides us with detailed information about the accuracy level, precision rate, and error percent of the model.
By using a confusion matrix, we can distinguish between the actual correct and predicted outcome of the categorical response variable.
So, having understood the need of Confusion Matrix, let us now focus on the various components through which we can judge and predict the right fit algorithm for any model.
Components of Confusion Matrix
Have a look at the below structure of Confusion Matrix!
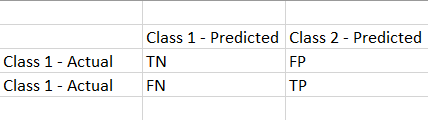
It represents the summary of the predictions performed by the classification models.
- TRUE NEGATIVE (TN): The values which are actually negative and also predicted as negative.
- FALSE NEGATIVE (FN): The values which are actually positive but predicted as negative.
- FALSE POSITIVE (FP): The values which are actually negative but predicted as positive.
- TRUE POSITIVE (TP): The values which are actually positive and predicted as positive too.
So, now let us have a look at the other information that the Confusion Matrix delivers about the model-
- Accuracy — It is defined as the value which shows the percentage of successful prediction from the input provided.
Accuracy = TP + TN / (TP + TN + FP + FN)
2. Precision score — It is the value that defines the set of values that are rightly predicted as True and also happens to be True in the actual set.
By precision, we mean to understand that the positive values are indeed predicted as positive.
Precision = TP / (TP + FP)
3. Recall score — It is the value that represents a set of values that are actually True and also predicted correctly as True,
By recall, we mean to understand that the particular class of samples is correctly predicted.
Recall = TP / (TP +FN)
4. F1 score
F1 score helps us rate the accuracy and efficiency of the model when the data is imbalanced. It is actually the harmonic mean of Precision and Recall scores.
F1 = 2*(Recall * Precision) / (Recall + Precision)
Let us now implement the concept of Confusion Matrix through an example as shown in the upcoming section.
Implementing Confusion Matrix in Python
In this example, we have passed a list of predicted values and actual values to build the confusion matrix. We need to import sklearn library in order to use the confusion matrix function.
from sklearn import metrics

pred = ["T", "F", "T", "T", "F"] #predicted set of values

actual = ["F", "F", "F", "T", "T"] #actual set of values
CM = metrics.confusion_matrix(pred, actual, labels=["T", "F"]) #confusion matrix

print(CM)
report = metrics.classification_report(pred, actual, labels=["T", "F"]) #precision, recall, f1-score,etc
print(report)
The classification_matrix() function represents the set of values that have been correctly and wrongly identified. Further, the classification_report() function represents the metrics value for each category of the inputs passed i.e. ‘T’ and ‘F’.
Output:
[[1 2]
 [1 1]]
              precision    recall  f1-score   support

           T       0.50      0.33      0.40         3
           F       0.33      0.50      0.40         2

    accuracy                           0.40         5
   macro avg       0.42      0.42      0.40         5
weighted avg       0.43      0.40      0.40         5
Conclusion
By this, we have come to the end of this topic. Feel free to comment below, in case you come across any question.
Till then, Happy Learning!


