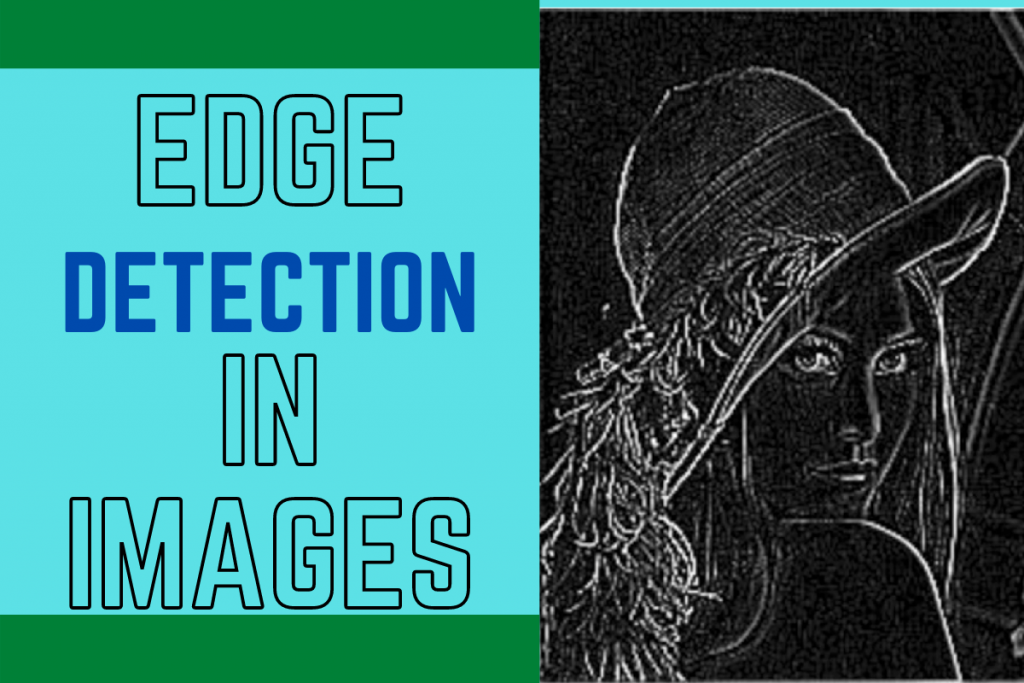
Hello fellow learner! Today we will be learning about edge detection in images and displaying the detected edges on the screen.
What do we mean by edge detection?
Before we begin, let’s understand what edge detection is.
Edge detection is used to find various boundaries/edges of various objects within a single image.
There are multiple edge detection algorithms and techniques available but one of the most popular and widely used algorithm is Canny edge detector.
Importing necessary modules
The first step is to import all the modules needed namely OpenCV, numpy, and matplotlib. We would also be setting the style according to our preference.
import cv2
import numpy as np
import matplotlib.pyplot as plt
plt.style.use('seaborn')
Loading and Plotting Image
Before we detect an image we have to read the image in our program using the imread method which will take the path of the image as a parameter.
To get the original colors we need to convert the colors to RGB format using the cvtColor function and apply it to the loaded image.
Just make sure the image is in the same folder as the project code file.
loaded_image = cv2.imread("image.jpg")
loaded_image = cv2.cvtColor(loaded_image,cv2.COLOR_BGR2RGB)
To load the image we make use of the matplotlib library. The code for the same is mentioned below.
We first set the figure size for better visualization and then use imshow method to plot the image. In addition to this, we will be turning the axis off to get a clear plot.
The code for the same is shown below.
plt.figure(figsize=(10,10))
plt.imshow(loaded_image,cmap="gray")
plt.axis("off")
plt.show()
Converting Image to Grayscale
Before we apply the Canny edge detector to the image, we need to convert the image to grayscale using the cvtColor function. and then plot the image in the same way we have plotted the original image.
gray_image = cv2.cvtColor(loaded_image,cv2.COLOR_BGR2GRAY)
plt.figure(figsize=(10,10))
plt.imshow(gray_image,cmap="gray")
plt.axis("off")
plt.show()
Applying Canny Algorithm for Edge Detection in Python
The final step is to apply the Canny Algorithm on the grayscale image we obtained in the previous step. The code for the same is shown below.
edged_image = cv2.Canny(gray_image, threshold1=30, threshold2=100)
The canny function requires three things: the grayscale image, the lower and higher pixel threshold values to be taken into consideration.
The next thing we need to do is plotting the edge detected image. The code for the same is shown below.
plt.figure(figsize=(10,10))
plt.imshow(edged_image,cmap="gray")
plt.axis("off")
plt.show()
The three plots are displayed below for your reference.

The Final Code for Edge Detection
import cv2
import numpy as np
import matplotlib.pyplot as plt
plt.style.use('seaborn')

loaded_image = cv2.imread("image.jpg")
loaded_image = cv2.cvtColor(loaded_image,cv2.COLOR_BGR2RGB)

gray_image = cv2.cvtColor(loaded_image,cv2.COLOR_BGR2GRAY)

edged_image = cv2.Canny(gray_image, threshold1=30, threshold2=100)


plt.figure(figsize=(20,20))
plt.subplot(1,3,1)
plt.imshow(loaded_image,cmap="gray")
plt.title("Original Image")
plt.axis("off")
plt.subplot(1,3,2)
plt.imshow(gray_image,cmap="gray")
plt.axis("off")
plt.title("GrayScale Image")
plt.subplot(1,3,3)
plt.imshow(edged_image,cmap="gray")
plt.axis("off")
plt.title("Canny Edge Detected Image")
plt.show()
The output of another image is displayed below.

Conclusion
Congratulations! Today in this tutorial, we learned how to detect edges in python. You can try out the same using different images.
Happy coding! Thank you for reading!
