This article talks about some of the best Python plotting and graph libraries out there! Before we begin with the list of the best libraries, let’s have a quick overview of why data visualization is necessary, and what
Why is Data Visualization Necessary?
In the age of booming Data Analysis, it is often more convenient to view the results of our analysis and infer results than going through textual data or csv files to understand the results.
Hence, data visualization is a simple way to find answers to complicated questions. It also allows users to express the results better than tables.

Top 5 Best Python Plotting and Graph Libraries
Here is a quick list of few Python plotting and graph libraries that we will discuss:
- Matplotlib: Plots graphs easily on all applications using its API.
- Seaborn: Versatile library based on matplotlib that allows comparison between multiple variables.
- ggplot: Produces domain-specific visualizations
- Bokeh: Preferred libraries for real-time streaming and data.
- Plotly: Allows very interactive graphs with the help of JS.
1. Matplotlib

Matplotlib is a plotting library for python. It provides an object-oriented API that allows us to plot the graphs in the application itself. It is free and open-source. Supports dozens of output types ad back-end.
Matplotlib allows the use of pandas as wrappers around its API. This library has a better run time and occupies a small memory space.
Benefits of using Matplotlib
- Understanding the correlation between the variables
- Communicates the model’s fitting of the data
- Scatter plots can be used for outlier detection
2. Seaborn

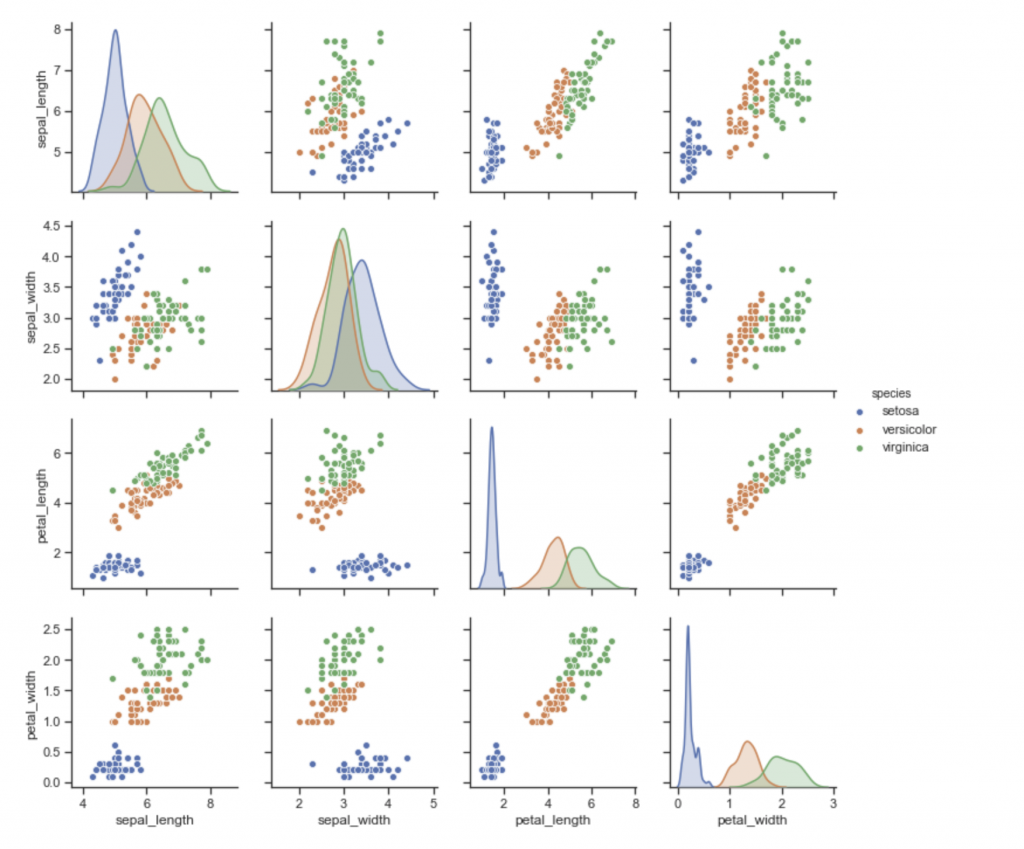
Seaborn is a data visualization library available in python, based on matplotlib. Seaborn has an API that is based on datasets that allow comparison between multiple variables.
It supports multi-plot grids that in turn ease the building of complex visualization. It has univariate and bivariate visualizations available to compare between subsets of data.
It makes use of different color palettes to reveal different kinds of patterns. It also estimates linear regression models automatically.
Seaborn vs Matplotlib
Matplotlib tries to make easy things easy and hard things possible, seaborn tries to define a well-defined set of hard things easy too. Factually matplotlib is good, but seaborn is better. Matplotlib leaves plots that are less attractive, but seaborn has high-level interfaces and customized themes to solve this issue.
When working with pandas, matplotlib does not serve well when dealing with data frames. Whereas seaborn functions work on data frames.
3. ggplot

Originally implemented in R, ggplot is one of the versatile libraries for plotting graphs in python. It is a Domain-Specific language for producing domain-specific visualizations, particularly for data analysis.
Ggplot allows the graph to be plotted in a simple manner using just 2 lines of code. However, the same code written using matplotlib is very complex and involves many lines of code. Hence, ggplot simplifies coding a graph. It is an extremely valuable library of python.
It is necessary to use pandas to achieve all the features of ggplot.
4. Bokeh

Bokeh, a library similar to ggplot, is based on The Grammar of Graphics. However, it is a library native to python and has not been imported from R. Creates interactive web-ready plots that can be outputted in various formats such as – HTML documents and JSON objects.
Bokeh has been one of the most preferred libraries for real-time streaming and data.
Bokeh is available in three levels to the users namely – High Level, Middle Level and Low Level. The high level users can create histograms and bar charts easily and quickly. The middle level users can use the matplotlib framework to create dots for scatter plots.
5. Plotly

Plotly is an online visualization platform with library support. Here, we can build interactive plots just like Bokeh, however with additional graphs such as contour plots, 3D charts, and dendrograms. Plotly also recognizes mouse-over and cursor-click events, thus making Plotly a unique library with both graphics and JavaScript.
Bokeh and Plotly are similar libraries however, with Plotly you will have to convert data into dictionaries. However, plotly is easier when it comes to handling data frames using Pandas.
To wrap it up…
It is advantageous and disadvantageous to use Python to plot graphs due to the simple reason that Python offers a wide variety of options. The choice of the best library entirely depends on the type of task you are trying to accomplish. Kindly note, no library is superior to the other, and the usage of each library depends on the user’s need.
Matplotlib however serves as the core of all these libraries and allows coders to wrap tools over it. Seaborn, making use of matplotlib, plots complex and interactive visualizations. Bokeh on the other hand helps create your own server for visualizations. Use these libraries and let us know what you feel in the comment section below.


