Hello there! Have you ever wondered that even images can be plotted as histograms? Today in this tutorial, we will understand the visualization of the colors in images in form of histograms.
Introduction
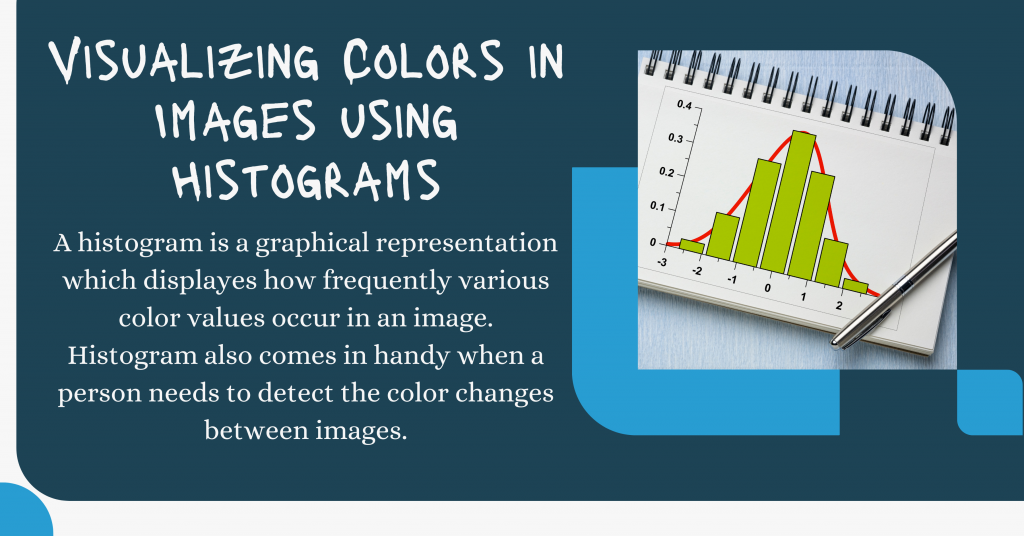
A histogram is a graphical representation that displays how frequently various color values occur in an image. The histogram also comes in handy when a person needs to detect the color changes between images.

The histogram focuses only on the proportion of the colors and not the location of the colors in the Images. They show the statistical distribution of colors and the essential tones present in the image.
Step-By-Step Implementation of Color Visualization
Now we will learn to plot RGB Histograms for various images.
Step 1 : Importing Modules
Just like any other project, the first step is to import the necessary modules/libraries into our program. The modules that are needed for this program are OpenCV, numpy, and matplotlib.
We will also be setting up the plotting style as seaborn to make our plots look cleaner. The code for the same is displayed below.
import cv2
import numpy as np
import matplotlib.pyplot as plt
plt.style.use('seaborn')
Step 2: Loading and Displaying the Original Image
To load the image, we will be using the imread function of the OpenCV library. The image can be loaded in different ways through the same function.
Read more on imread here: Different ways to load an image using the OpenCV.imread() method
Now in order to display the image, we are required to use the imshow function under the matplotlib library. To make images look cleaner, we will be turning the axis off.
image = cv2.imread('image1.jpg')
plt.axis("off")
plt.title("Original Image")
plt.imshow(cv2.cvtColor(image, cv2.COLOR_BGR2RGB))
plt.show()

Step 3 – Getting RGB Histograms for Images
In order to get RGB histograms we would be using the cakHist function which requires a number of parameters including the image object, the bin count, the range of values needed, and the channel ( blue, red, or green ).
The code for the same is mentioned below. The image object is mentioned in square brackets ([]), the channel is set to 0,1 and 2 for blue, red, and green respectively.
Now we plot the histograms with the help of subplots.
blue_histogram = cv2.calcHist([image], [0], None, [256], [0, 256])
red_histogram = cv2.calcHist([image], [1], None, [256], [0, 256])
green_histogram = cv2.calcHist([image], [2], None, [256], [0, 256])

plt.subplot(3,1,1)
plt.title("histogram of Blue")
plt.hist(blue_histogram,color="darkblue")

plt.subplot(3,1,2)
plt.title("histogram of Green")
plt.hist(green_histogram,color="green")

plt.subplot(3,1,3)
plt.title("histogram of Red")
plt.hist(red_histogram,color="red")

plt.tight_layout()
plt.show()

We can plot the same histogram in form of lines using the plot function and pass the same calcHist data found. The code and output for the same are shown below.
blue_histogram = cv2.calcHist([image], [0], None, [256], [0, 256])
red_histogram = cv2.calcHist([image], [1], None, [256], [0, 256])
green_histogram = cv2.calcHist([image], [2], None, [256], [0, 256])

plt.subplot(3,1,1)
plt.title("Line Plot of Blue")
plt.plot(blue_histogram,color="darkblue")

plt.subplot(3,1,2)
plt.title("Line Plot of Green")
plt.plot(green_histogram,color="green")

plt.subplot(3,1,3)
plt.title("Line Plot of Red")
plt.plot(red_histogram,color="red")

plt.tight_layout()
plt.show()

We can also plot all the hist plots and line plots for all the three colors together in one! Let’s check it out as well!
blue_histogram = cv2.calcHist([image], [0], None, [256], [0, 256])
red_histogram = cv2.calcHist([image], [1], None, [256], [0, 256])
green_histogram = cv2.calcHist([image], [2], None, [256], [0, 256])

plt.subplot(2,1,1)
plt.title("Histogram of All Colors")
plt.hist(blue_histogram,color="darkblue")
plt.hist(green_histogram,color="green")
plt.hist(red_histogram,color="red")

plt.subplot(2,1,2)
plt.title("Line Plots of All Colors")
plt.plot(blue_histogram,color="darkblue")
plt.plot(green_histogram,color="green")
plt.plot(red_histogram,color="red")

plt.tight_layout()
plt.show()

Visualizing the Final Results All together!
Now let’s visualize all the results of the input image in one single frame! The results are very exciting to see as well.
The complete code for the same is displayed below.
import cv2
import numpy as np
import matplotlib.pyplot as plt
plt.style.use('seaborn')plt.figure(figsize=(40,10))

plt.subplot(1,3,1)
image = cv2.imread('image1.jpg')
plt.axis("off")
plt.title("Original Image")
plt.imshow(cv2.cvtColor(image, cv2.COLOR_BGR2RGB))

blue_histogram = cv2.calcHist([image], [0], None, [256], [0, 256])
red_histogram = cv2.calcHist([image], [1], None, [256], [0, 256])
green_histogram = cv2.calcHist([image], [2], None, [256], [0, 256])

plt.subplot(1,3,2)
plt.title("Histogram of All Colors")
plt.hist(blue_histogram,color="darkblue")
plt.hist(green_histogram,color="green")
plt.hist(red_histogram,color="red")

plt.subplot(1,3,3)
plt.title("Line Plots of All Colors")
plt.plot(blue_histogram,color="darkblue")
plt.plot(green_histogram,color="green")
plt.plot(red_histogram,color="red")

plt.tight_layout()
plt.show()

More Outputs
Let’s have a look at some more sample outputs. Look how exciting the results are!


Conclusion
I hope you understood the concept and loved the outputs. Try out the same with more images and get amazed with the results.
Happy Coding! 😇
Want to learn more? Check out the tutorials mentioned below:
- Python Matplotlib Tutorial
- Boxplots: Everything you need to know
- Data Visualization using Python Bokeh
