🚀 Supercharge your YouTube channel's growth with AI.
Try YTGrowAI Free14 Ways to Filter Pandas Dataframes

Whenever we work with data of any sort, we need a clear picture of the kind of data that we are dealing with. For most of the data out there, which may contain thousands or even millions of entries with a wide variety of information, it’s really impossible to make sense of that data without any tool to present the data in a short and readable format.
Also read: Get Head and Tail of a Pandas Dataframe or Series
Most of the time we need to go through the data, manipulate it, and visualize it for getting insights. Well, there is a great library which goes by the name pandas which provides us with that capability. The most frequent Data manipulation operation is Data Filtering. It is very similar to the WHERE clause in SQL or you must have used a filter in MS Excel for selecting specific rows based on some conditions.
pandas is a powerful, flexible and open source data analysis/manipulation tool which is essentially a python package that provides speed, flexibility and expressive data structures crafted to work with “relational” or “labelled” data in an intuitive and easy manner. It is one of the most popular libraries to perform real-world data analysis in Python.
pandas is built on top of the NumPy library which aims to integrate well with the scientific computing environment and numerous other 3rd party libraries. It has two primary data structures namely Series (1D) and Dataframes(2D), which in most real-world use cases is the type of data that is being dealt with in many sectors of finance, scientific computing, engineering and statistics.
Let’s Start Filtering Data With the Help of Pandas Dataframe
Installing pandas
!pip install pandas
Importing the Pandas library, reading our sample data file and assigning it to “df” DataFrame
import pandas as pd
df = pd.read_csv(r"C:\Users\rajam\Desktop\sample_data.csv")
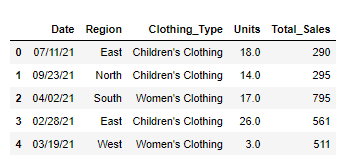
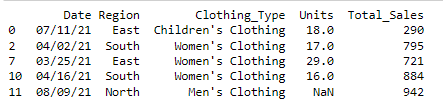
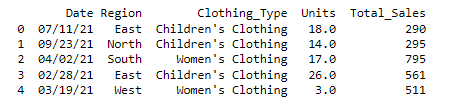
Let’s check out our dataframe:
print(df.head())
Now that we have our DataFrame, we will be applying various methods to filter it.
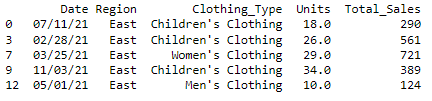
Method – 1: Filtering DataFrame by column value
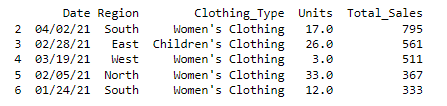
We have a column named “Total_Sales” in our DataFrame and we want to filter out all the sales value which is greater than 300.
#Filter a DataFrame for a single column value with a given condition

greater_than = df[df['Total_Sales'] > 300]
print(greater_than.head())
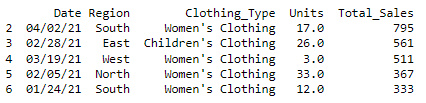
Method – 2: Filtering DataFrame based on multiple conditions
Here we are filtering all the values whose “Total_Sales” value is greater than 300 and also where the “Units” is greater than 20. We will have to use the python operator “&” which performs a bitwise AND operation in order to display the corresponding result.
#Filter a DataFrame with multiple conditions

filter_sales_units = df[(df['Total_Sales'] > 300) & (df["Units"] > 20)]
print(Filter_sales_units.head())
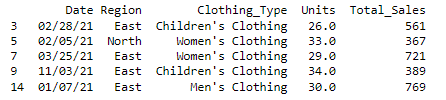
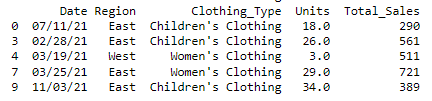
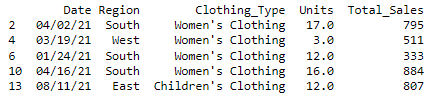
Method – 3: Filtering DataFrame based on Date value
If we want to filter our data frame based on a certain date value, for example here we are trying to get all the results based on a particular date, in our case the results after the date ’03/10/21′.
#Filter a DataFrame based on specific date

date_filter = df[df['Date'] > '03/10/21']
print(date_filter.head())
Method – 4: Filtering DataFrame based on Date value with multiple conditions
Here we are getting all the results for our Date operation evaluating multiple dates.
#Filter a DataFrame with multiple conditions our Date value

date_filter2 = df[(df['Date'] >= '3/25/2021') & (df['Date'] <'8/17/2021')]
print(date_filter2.head())
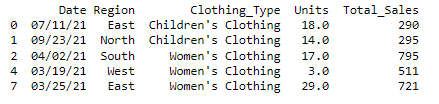
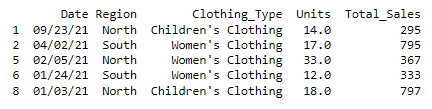
Method – 5: Filtering DataFrame based on a specific string
Here we are selecting a column called ‘Region’ and getting all the rows that are from the region ‘East’, thus filtering based on a specific string value.
#Filter a DataFrame to a specific string

east = df[df['Region'] == 'East']
print(east.head())
Method – 6: Filtering DataFrame based on a specific index value in a string
Here we are selecting a column called ‘Region’ and getting all the rows which has the letter ‘E’ as the first character i.e at index 0 in the specified column results.
#Filter a DataFrame to show rows starting with a specfic letter

starting_with_e = df[df['Region'].str[0]== 'E']
print(starting_with_e.head())

Method – 7: Filtering DataFrame based on a list of values
Here we are filtering rows in the column ‘Region’ which contains the values ‘West’ as well as ‘East’ and display the combined result. Two methods can be used to perform this filtering namely using a pipe | operator with the corresponding desired set of values with the below syntax OR we can use the .isin() function to filter for the values in a given column, which in our case is the ‘Region’, and provide the list of the desired set of values inside it as a list.
#Filter a DataFrame rows based on list of values

#Method 1:
east_west = df[(df['Region'] == 'West') | (df['Region'] == 'East')]
print(east_west)

#Method 2:
east_west_1 = df[df['Region'].isin(['West', 'East'])]
print(east_west_1.head())

Method – 8: Filtering DataFrame rows based on specific values using RegEx
Here we want all the values in the column ‘Region’, which ends with ‘th’ in their string value and display them. In other words, we want our results to show the values of ‘North‘ and ‘South‘ and ignore ‘East’ and ‘West’. The method .str.contains() with the specified values along with the $ RegEx pattern can be used to get the desired results.
For more information please check the Regex Documentation
#Filtering the DataFrame rows using regular expressions(REGEX)

regex_df = df[df['Region'].str.contains('th$')]
print(regex_df.head())
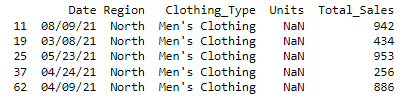
Method – 9: Filtering DataFrame to check for null
Here, we’ll check for null and not null values in all the columns with the help of isnull() function.
#Filtering to check for null and not null values in all columns

df_null = df[df.isnull().any(axis=1)]
print(df_null.head())
Method – 10: Filtering DataFrame to check for null values in a specific column.
#Filtering to check for null values if any in the 'Units' column

units_df = df[df['Units'].isnull()]
print(units_df.head())

Method – 11: Filtering DataFrame to check for not null values in specific columns
#Filtering to check for not null values in the 'Units' column

df_not_null = df[df['Units'].notnull()]
print(df_not_null.head())
Method – 12: Filtering DataFrame using query() with a condition
#Using query function in pandas

df_query = df.query('Total_Sales > 300')
print(df_query.head())
Query FunctionMethod – 13: Filtering DataFrame using query() with multiple conditions
#Using query function with multiple conditions in pandas

df_query_1 = df.query('Total_Sales > 300 and Units <18')
print(df_query_1.head())
Query FunctionMethod – 14: Filtering our DataFrame using the loc and iloc functions.
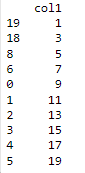
#Creating a sample DataFrame for illustrations

import numpy as np
data = pd.DataFrame({"col1" : np.arange(1, 20 ,2)}, index=[19, 18 ,8, 6, 0, 1, 2, 3, 4, 5])
print(data)
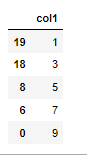
Explanation: iloc considers rows based on the position of the given index, so that it takes only integers as values.
For more information please check out Pandas Documentation
#Filter with iloc

data.iloc[0 : 5]
ilocExplanation: loc considers rows based on index labels
#Filter with loc

data.loc[0 : 5]
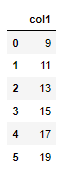
locYou might be thinking about why the loc function returns 6 rows instead of 5 rows. This is because loc does not produce output based on index position. It considers labels of index only which can be an alphabet as well and includes both starting and endpoint.
Conclusion
So, these were some of the most common filtering methods used in pandas. There are many other filtering methods that could be used, but these are some of the most common. When choosing a filtering method, it is important to consider the data you are trying to filter, the type of data, and the type of filtering you are trying to do. Hope you enjoyed this article. To learn more, don’t forget to read out Pandas tutorials.
Additional References


