🚀 Supercharge your YouTube channel's growth with AI.
Try YTGrowAI FreePython Breakpoint: How to Use It in pdb

Inspecting a Python program at a chosen point starts with pausing execution there. Python’s breakpoint() function pauses at its call site and opens the configured debugger, which uses pdb by default.
This article shows how to use pdb to check a value before continuing the program.
TL;DR: Python breakpoint()
Python’s breakpoint() pauses execution and opens the configured debugger at the call site, using pdb by default.
- Put breakpoint() on the line where you want to inspect program state.
- Use p expression to inspect a value, n to move forward, and c to continue.
- Set PYTHONBREAKPOINT=0 to make these calls return without entering a debugger.
What Is breakpoint() in Python?
breakpoint() is a built-in function that calls sys.breakpointhook(), which by default enters Python’s pdb debugger at that point in the program. Python added it in version 3.7, so use Python 3.7 or newer for this built-in.
A debugger pause gives you an interactive prompt in the current frame. You can evaluate expressions against the local variables, inspect the source, and choose whether to step or resume. It differs from print() because the program waits for your command instead of writing a value and carrying on.
The prompt is a debugger command interface, not a fresh Python REPL. Commands such as p total ask pdb to evaluate an expression in the paused frame. Use the commands l and where when you need nearby source or the call stack before deciding which value to inspect.
The default hook is pdb.set_trace(). The indirection through sys.breakpointhook() lets the same breakpoint() call route through a configured hook. That distinction matters when code with breakpoints moves from local development into automated tests or a deployed process.
Use the standard library’s pdb documentation for the full command set. AskPython’s locals() guide explains the mapping of names available in a Python scope, which can help when inspecting frame values.
How to Use breakpoint() Step by Step
Place the call after calculating a value you want to check, run the script in a terminal, and issue pdb commands at its prompt. I ran the following small pricing function and inspected its total before allowing it to return.
Step 1: Add a breakpoint after the calculation
The function calculates a price including tax, then pauses before returning the result. Save this as breakpoint_demo.py.
def total_with_tax(price, rate):
    total = price * (1 + rate)
    breakpoint()
    return round(total, 2)

print(total_with_tax(80, 0.1))
Step 2: Run the file and inspect the local value
Start the program with Python, then enter pdb commands. The pipe below supplies p total to display the local variable and c to continue. In an ordinary interactive terminal, type each command at the (Pdb) prompt instead.
printf 'p total\nc\n' | python3 breakpoint_demo.py
vijaykrishna@askpython:~$ printf 'p total\nc\n' | python3 breakpoint_demo.py
> /home/ubuntu/.cache/journaldev-article-runs/askpython-python-breakpoint-function/breakpoint_demo.py(4)total_with_tax()
-> return round(total, 2)
(Pdb) 88.0
(Pdb) 88.0
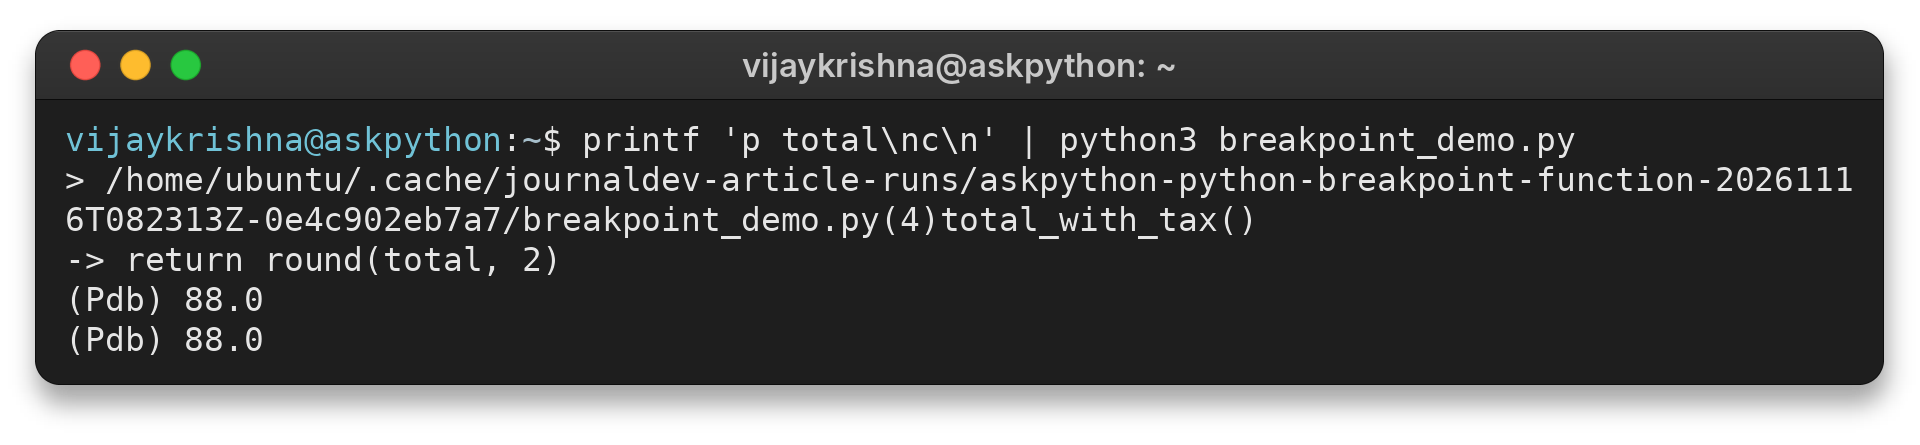
The first 88.0 is the value printed by pdb for total. The second is the function’s returned value after c resumes execution. Use p expression for inspection, n to execute the current line and stop at the next line in the frame.
Use c to run until another breakpoint or program exit, or enter q to stop the program from the debugger. The help command lists more actions, and l displays nearby source lines. These commands let you check a value before deciding whether to step into more code or let the current run finish.
Step 3: Remove the pause from a routine run
For a noninteractive run, set PYTHONBREAKPOINT=0 in the command environment. The source file stays the same, but breakpoint() becomes a no-op, so the program can continue without waiting for debugger input.
I ran the file with that setting and it printed 88.0, then exited normally. The change applies to calls handled by the default hook in that process, not to a direct call to pdb.set_trace().
PYTHONBREAKPOINT=0 python3 breakpoint_demo.py
88.0
breakpoint() Edge Cases and Hook Settings
The built-in forwards its arguments to sys.breakpointhook(), so the accepted arguments depend on the active hook. The default pdb hook takes no arguments, and a call with one raises a TypeError.
I tested the mistaken call breakpoint(1) in a named Python file. The default hook returned this TypeError:
python3 breakpoint_argument_error.py
Traceback (most recent call last):
  File "/home/ubuntu/.cache/journaldev-article-runs/askpython-python-breakpoint-function-20261116T082313Z-0e4c902eb7a7/breakpoint_argument_error.py", line 1, in <module>
    breakpoint(1)
TypeError: set_trace() takes 0 positional arguments but 1 was given
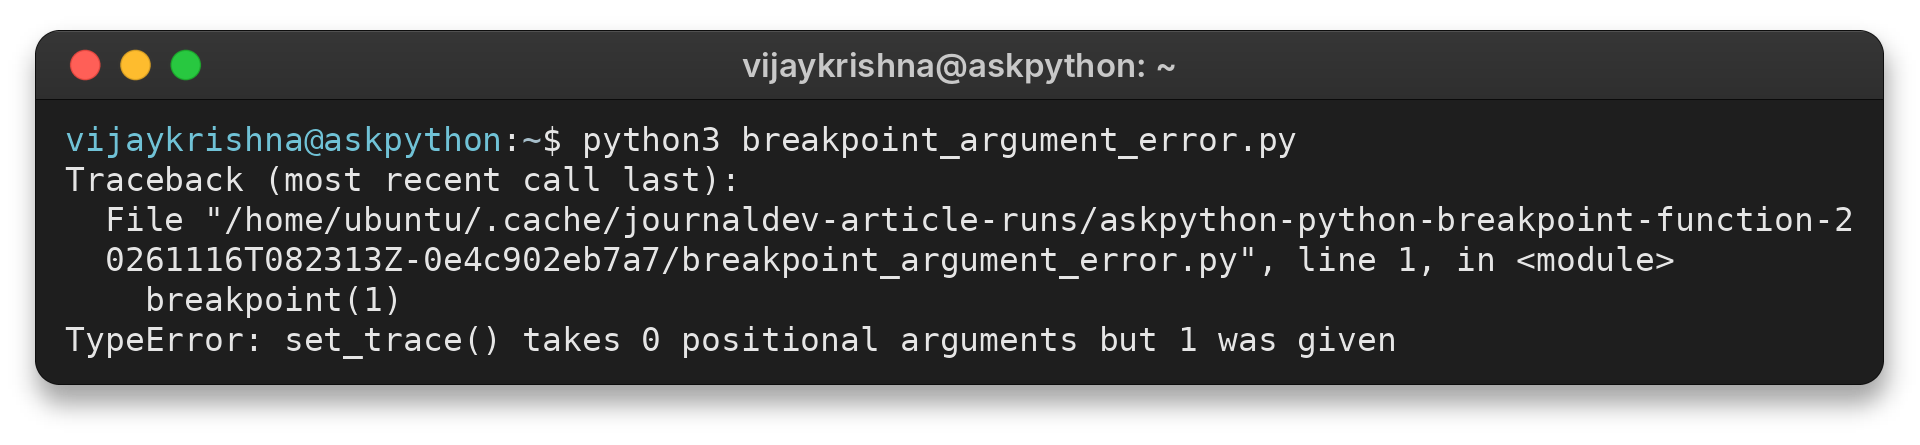
Put the call on the desired source line instead of passing a line number. The pdb command b can set a further breakpoint by line or function after the debugger starts.
A script that reads piped input can also consume the same standard input that pdb needs for commands. The debugger may then see end-of-file rather than your typed instruction. Run the program in a terminal with interactive input available, or arrange the application’s input handling so the debugger has a terminal.
The environment variable selects the default hook’s behavior. An empty or missing value uses pdb, while 0 disables the pause.
Another value names a dotted module path and callable. For example, PYTHONBREAKPOINT=package.module.debugger selects debugger from that module, provided the callable is installed and importable. Check that its package is available in the same Python environment before selecting the path.
A program can also assign a custom function to sys.breakpointhook. Once that attribute is overridden, the default hook no longer consults PYTHONBREAKPOINT. Keep the environment setting and the programmatic override distinct when diagnosing why a breakpoint enters a different debugger or does nothing.
PYTHONBREAKPOINT=0 python3 breakpoint_demo.py
Conclusion
Place breakpoint() at the line worth inspecting, use pdb to check the active frame, and continue when you have the value you need. For routine execution, configure the default hook deliberately so an interactive pause does not interrupt a process without a terminal.
Use the official breakpoint() reference for the built-in and the sys.breakpointhook() reference for hook settings. For broader debugging approaches, see AskPython’s Python debugging guide.
FAQ
These brief answers cover questions that come up when adding a pause to a Python script.
Can I run Python code at a breakpoint?
Yes. At the pdb prompt, enter a Python expression such as p total to inspect a value. Use n or c to resume execution.
How do I exit the Python debugger?
Enter c to continue the program. Enter q to quit the debugger and abort the program.
How can I disable breakpoint() calls?
Run the process with PYTHONBREAKPOINT=0 to make the default hook return without entering pdb.