🚀 Supercharge your YouTube channel's growth with AI.
Try YTGrowAI FreeBox Office Revenue Prediction in Python – An Easy Implementation

Hello there! Today by end of this tutorial, we will be performing box office revenue prediction using linear regression. Let’s begin!
Step-by-Step Box Office Revenue Prediction
In this Machine Learning project, we will predict box office revenues with the help of Linear Regression which is one of the most popular Machine Learning algorithms.
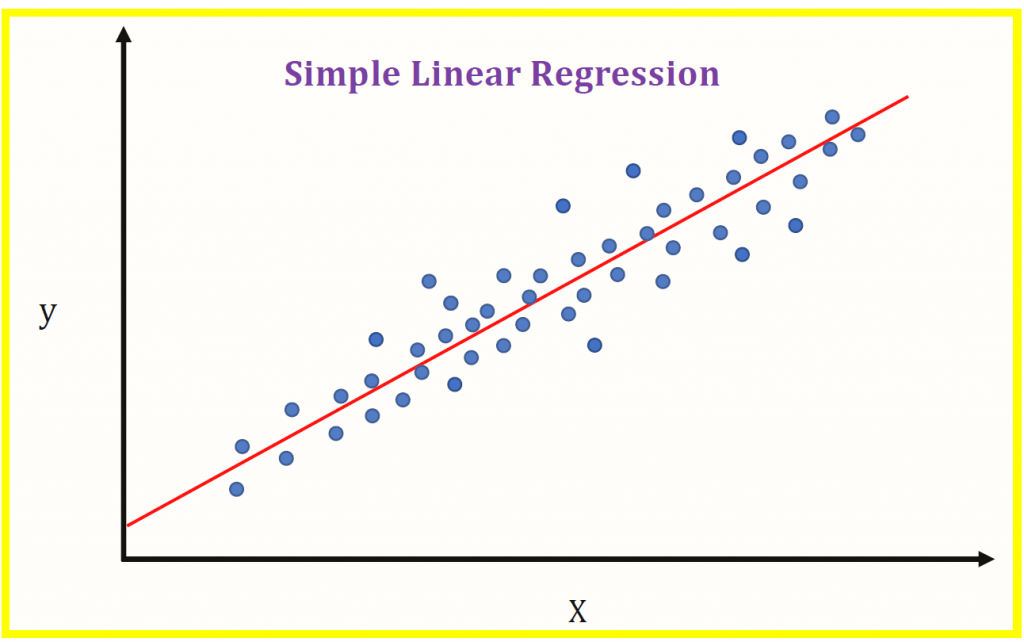
IBM stated that
“Linear regression analysis is used to predict the value of a variable based on the value of another variable. The variable you want to predict is called the dependent variable. The variable you are using to predict the other variable’s value is called the independent variable.“
1. Importing Modules
Let’s start with importing the modules for our project. We’ll be working with pandas and matplotlib along with sklearn here.
import pandas
from pandas import DataFrame
import matplotlib.pyplot as plt
from sklearn.linear_model import LinearRegression

plt.style.use('seaborn')
2. Loading the Data
The next step is to load the data which can be found here.
In order to load the data, we would require the read_csv function. Let’s also look at the shape of data as well as a description of the data.
data = pandas.read_csv('cost_revenue_clean.csv')
print("Shape of data is: ",data.shape)

print("Description of data")
data.describe()

3. Data Visualization
Now that we have loaded the data successfully, it’s time to visualize the data in the form of a scatter plot.
First, we make two DataFrame from the initial loaded data including the production cost and the global revenue being generated. We will be storing both as X and Y data points respectively and plot the points using plt.scatter function.
Below is the code for the step that was just described above.
X = DataFrame(data, columns=['production_budget_usd'])
y = DataFrame(data, columns=['worldwide_gross_usd'])

plt.figure(figsize=(10,6))
plt.scatter(X, y, alpha=0.3)
plt.title('Film Cost vs Global Revenue')
plt.xlabel('Production Budget $')
plt.ylabel('Worldwide Gross $')
plt.ylim(0, 3000000000)
plt.xlim(0, 450000000)
plt.show()

4. Apply Linear Regression
The last step in the process is to apply linear regression which includes the following major steps:
Create a LinearRegression object and fit the X and Y data points in the model object we just created
regression = LinearRegression()
regression.fit(X, y)
Now let’s see how the linear points we just generated as output of the model look in form of a straight line. The same can be seen with the code mentioned below.
plt.plot(X, regression.predict(X), color='red', linewidth=3)
plt.title("Final Linear Regression Line Plot")
plt.plot()

But are we able to understand if the plot is right or not, right? So let’s plot the line along with the scatter plot of the data. The code below will display the final plot.
plt.scatter(X, y, alpha=0.3,color="green")
plt.plot(X, regression.predict(X), color='red', linewidth=3)
plt.title("Final Linear Regression Plot")
plt.plot()

Box Office Revenue Prediction Implemented in Python
Let’s now combine all the pieces of code from the top and see what our complete code looks like.
import pandas as pd
import matplotlib.pyplot as plt
from sklearn.linear_model import LinearRegression
plt.style.use('seaborn')

data = pd.read_csv('cost_revenue_clean.csv')

X = pd.DataFrame(data, columns=['production_budget_usd'])
y =pd.DataFrame(data, columns=['worldwide_gross_usd'])

plt.figure(figsize=(10,6))
plt.subplot(1,2,1)
plt.scatter(X, y, alpha=0.3)
plt.title('Film Cost vs Global Revenue')
plt.xlabel('Production Budget $')
plt.ylabel('Worldwide Gross $')
plt.ylim(0, 3000000000)
plt.xlim(0, 450000000)

plt.subplot(1,2,2)
plt.scatter(X, y, alpha=0.3,color="green")
plt.plot(X, regression.predict(X), color='red', linewidth=3)
plt.title("Final Linear Regression Plot")
plt.plot()

plt.show()

Conclusion
I hope you understood the concept and loved the outputs. Try out the same data on your system. Happy Coding! 😇
Want to learn more? Check out the tutorials mentioned below:
- Regression vs Classification in Machine Learning
- Linear Regression from Scratch in Python
- Simple Linear Regression: A Practical Implementation in Python


