🚀 Supercharge your YouTube channel's growth with AI.
Try YTGrowAI FreeSimple Linear Regression: A Practical Implementation in Python

Welcome to this article on simple linear regression. Today we will look at how to build a simple linear regression model given a dataset. You can go through our article detailing the concept of simple linear regression prior to the coding example in this article.
6 Steps to build a Linear Regression model
Step 1: Importing the dataset
Step 2: Data pre-processing
Step 3: Splitting the test and train sets
Step 4: Fitting the linear regression model to the training set
Step 5: Predicting test results
Step 6: Visualizing the test results
Now that we have seen the steps, let us begin with coding the same
Implementing a Linear Regression Model in Python
In this article, we will be using salary dataset. Our dataset will have 2 columns namely – Years of Experience and Salary.
The link to the dataset is – https://github.com/content-anu/dataset-simple-linear
1. Importing the dataset
We will begin with importing the dataset using pandas and also import other libraries such as numpy and matplotlib.
import numpy as np
import pandas as pd
import matplotlib.pyplot as plt
dataset = pd.read_csv('Salary_Data.csv')
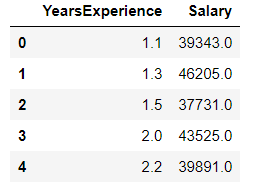
dataset.head()
The dataset.head() shows the first few columns of our dataset. The output of the above snippet is as follows:
2. Data Preprocessing
Now that we have imported the dataset, we will perform data preprocessing.
X = dataset.iloc[:,:-1].values  #independent variable array
y = dataset.iloc[:,1].values  #dependent variable vector
The X is independent variable array and y is the dependent variable vector. Note the difference between the array and vector. The dependent variable must be in vector and independent variable must be an array itself.
3. Splitting the dataset
We need to split our dataset into the test and train set. Generally, we follow the 20-80 policy or the 30-70 policy respectively.
Why is it necessary to perform splitting? This is because we wish to train our model according to the years and salary. We then test our model on the test set.
We check whether the predictions made by the model on the test set data matches what was given in the dataset.
If it matches, it implies that our model is accurate and is making the right predictions.
from sklearn.model_selection import train_test_split
X_train, X_test, y_train, y_test = train_test_split(X,y,test_size=1/3,random_state=0)
We don’t need to apply feature scaling for linear regression as libraries take care of it.
4. Fitting linear regression model into the training set
From sklearn’s linear model library, import linear regression class. Create an object for a linear regression class called regressor.
To fit the regressor into the training set, we will call the fit method – function to fit the regressor into the training set.
We need to fit X_train (training data of matrix of features) into the target values y_train. Thus the model learns the correlation and learns how to predict the dependent variables based on the independent variable.
from sklearn.linear_model import LinearRegression
regressor = LinearRegression()
regressor.fit(X_train,y_train) #actually produces the linear eqn for the data

5. Predicting the test set results
We create a vector containing all the predictions of the test set salaries. The predicted salaries are then put into the vector called y_pred.(contains prediction for all observations in the test set)
predict method makes the predictions for the test set. Hence, the input is the test set. The parameter for predict must be an array or sparse matrix, hence input is X_test.
y_pred = regressor.predict(X_test)
y_pred

y_test

y_test is the real salary of the test set.y_pred are the predicted salaries.
Visualizing the results
Let’s see what the results of our code will look like when we visualize it.
1. Plotting the points (observations)
To visualize the data, we plot graphs using matplotlib. To plot real observation points ie plotting the real given values.
The X-axis will have years of experience and the Y-axis will have the predicted salaries.
plt.scatter plots a scatter plot of the data. Parameters include :
- X – coordinate (X_train: number of years)
- Y – coordinate (y_train: real salaries of the employees)
- Color ( Regression line in red and observation line in blue)
2. Plotting the regression line
plt.plot have the following parameters :
- X coordinates (X_train) – number of years
- Y coordinates (predict on X_train) – prediction of X-train (based on a number of years).
Note : The y-coordinate is not y_pred because y_pred is predicted salaries of the test set observations.
#plot for the TRAIN

plt.scatter(X_train, y_train, color='red') # plotting the observation line

plt.plot(X_train, regressor.predict(X_train), color='blue') # plotting the regression line

plt.title("Salary vs Experience (Training set)") # stating the title of the graph

plt.xlabel("Years of experience") # adding the name of x-axis
plt.ylabel("Salaries") # adding the name of y-axis
plt.show() # specifies end of graph
The above code generates a plot for the train set shown below:

#plot for the TEST

plt.scatter(X_test, y_test, color='red')
plt.plot(X_train, regressor.predict(X_train), color='blue') # plotting the regression line

plt.title("Salary vs Experience (Testing set)")

plt.xlabel("Years of experience")
plt.ylabel("Salaries")
plt.show()
The above code snippet generates a plot as shown below:

Complete Python Code for Implementing Linear Regression
# importing the dataset
import numpy as np
import pandas as pd
import matplotlib.pyplot as plt

dataset = pd.read_csv('Salary_Data.csv')
dataset.head()

# data preprocessing
X = dataset.iloc[:, :-1].values  #independent variable array
y = dataset.iloc[:,1].values  #dependent variable vector

# splitting the dataset
from sklearn.model_selection import train_test_split
X_train, X_test, y_train, y_test = train_test_split(X,y,test_size=1/3,random_state=0)

# fitting the regression model
from sklearn.linear_model import LinearRegression
regressor = LinearRegression()
regressor.fit(X_train,y_train) #actually produces the linear eqn for the data

# predicting the test set results
y_pred = regressor.predict(X_test)
y_pred

y_test

# visualizing the results
#plot for the TRAIN

plt.scatter(X_train, y_train, color='red') # plotting the observation line
plt.plot(X_train, regressor.predict(X_train), color='blue') # plotting the regression line
plt.title("Salary vs Experience (Training set)") # stating the title of the graph

plt.xlabel("Years of experience") # adding the name of x-axis
plt.ylabel("Salaries") # adding the name of y-axis
plt.show() # specifies end of graph

#plot for the TEST

plt.scatter(X_test, y_test, color='red')
plt.plot(X_train, regressor.predict(X_train), color='blue') # plotting the regression line
plt.title("Salary vs Experience (Testing set)")

plt.xlabel("Years of experience")
plt.ylabel("Salaries")
plt.show()
The output of the above code snippet is as shown below:

Conclusion
We have come to the end of this article on Simple Linear Regression. Hope you liked our example and have tried coding the model as well. Do let us know your feedback in the comment section below.
If you’re interested in more regression models, do read through multiple linear regression model.


