🚀 Supercharge your YouTube channel's growth with AI.
Try YTGrowAI FreePython Plot: Create Animated Plots in Python

Till now you must have seen basic matplotlib plots, but the same matplotlib module can be used to have animated plots as well! Let’s see how to build the same!
Importing necessary modules
import numpy as np
import matplotlib.pyplot as plt
import matplotlib.animation as animation
import random
from itertools import count
from IPython import display
The table below shows each module and their requirement:
| Module Name | Requirement |
| Numpy module | Used to create a dataset for the plotting. |
| Matplotlib module | To plot the plots required |
| matplotlib.animation | To provide functionalities for the animated plots |
| random | To generate random points for random intervals intially |
| count module | To generate a series of consecutive numbers |
| display module | To display the videos of the animated plots |
Creating a dataset for the animated plots in Python
To create the dataset we create two lists namely x and y , where x stores the x-coordinates and y stores the y-coordinates.
Now x-coordinates are consecutive numbers. We will use the cound module that does the counting of numbers starting from 0 after creating a count iterator using the count function. Also to access the next number we make use of the next function.
For the y-coordinates, we will be using the random module to choose any random integer between two integers. The code below implements the same which includes an animate function which does the incrementation in the values:
x=[]
y=[]
i = count()
def animate(j):
    x.append(next(i))
    y.append(random.randint(0, 10))
    plt.plot(x,y)
Creating the animation object
The next step involves creating an object named animation_1. To implement the animate function on repeat after a certain intervals of time we make use of the FuncAnimation which takes a few parameters which are mentioned below:
- plt.gcf() : To take the function mentioned as the next parameter as the ‘current function’.
- Function name: In this case it’s animate.
- interval: Set the time after which the function is repeated.
animation_1 = animation.FuncAnimation(plt.gcf(),animate,interval=1000)
plt.show()
If you are using python IDLE , a plot will automatically generate. But, in case you are using jupyter notebook , even after using the plt.show() function after the code, nothing will get printed as an output. To avoid this one needs to covert the video formed in HTML form which is mentioned in the next section.
Coverting the animated plot to HTML video (For Jupyter Notebook users)
We first need to convert the animation created to html5 video which is done in line number 1 in the code shown below. The line number 2 creates an HTML code to display the html5 video. Lastly line number 3 displays the html code we generated to display the video.
video_1 = animation_1.to_html5_video()
html_code_1 = display.HTML(video_1)
display.display(html_code_1)
plt.tight_layout()
plt.show()
Later in line number 4 and 5 we can simply plot the points. The output of the code results in something which is shown below. Your plot can be different than mine as the points are generated randomly.
The picture below shows the final plot after a certain point of time.

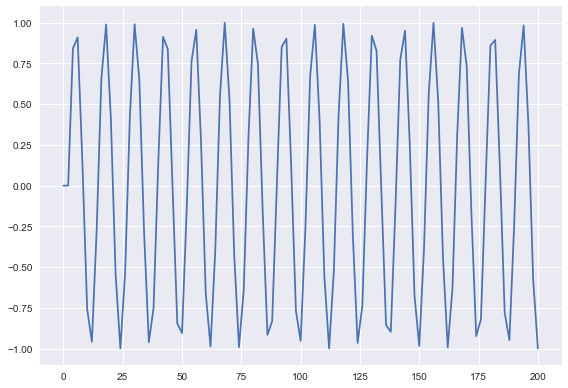
Plotting an animated sin wave plot
We can plot a nice sine wave using the code below. Few changes we made are as follows:
- Using double of the count value generated as x-coordinate for better plot
- Decreasing the interval in the animation function to have a clearer visualization
x1=[]
y1=[]
i1 = count()
def animate1(j):
    t=next(i1)
    x1.append(2*t)
    y1.append(np.sin(t))
    plt.cla()
    plt.plot(x1,y1)
animation_2 = animation.FuncAnimation(plt.gcf(),animate1,interval=50)
video_2 = animation_2.to_html5_video()
html_code_2 = display.HTML(video_2)
display.display(html_code_2)
plt.tight_layout()
plt.show()
The output animated plot and the static plot after a certain interval is shown below.
Plotting Both Sine and Cosine on the same animated plot
Check out the code below to view both the animated curves on the same animation. We take separate y values one for sine and one for cosine curve and plot both of them on the same animation. Also, let’s spice it up a little by using ‘dark_background’.
plt.style.use('dark_background')
x=[]
y_sin=[]
y_cos=[]
i_n = count()
def animate_n(j):
    t=2*next(i)
    x.append(t)
    y_sin.append(np.sin(t))
    y_cos.append(np.cos(t))
    plt.cla()
    plt.plot(x,y_sin,label="Sine wave",color="red")
    plt.plot(x,y_cos,label="Cosine wave",color="green")
animation_n = animation.FuncAnimation(plt.gcf(),animate_n,interval=500)
video_n = animation_n.to_html5_video()
html_code_n = display.HTML(video_n)
display.display(html_code_n)
plt.tight_layout()
plt.show()
The animation below is the result of the code above.
Conclusion
Congratulations! Today you learned how to plot animated plots using the matplotlib module. Hope you enjoyed coding them on your own. Thank you for reading! Happy coding and Learning!


