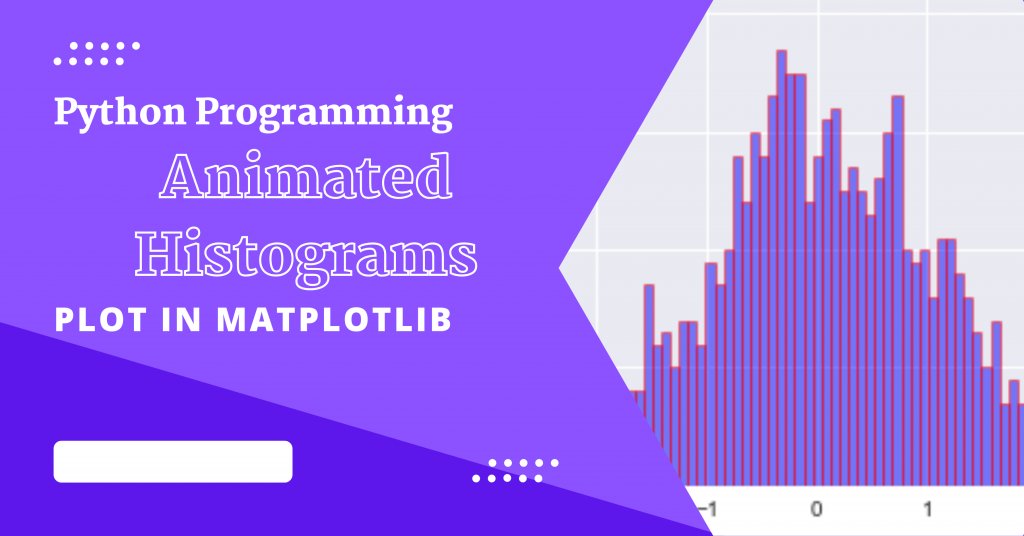
Hey folks! Today, we are going to program in order to obtain animated histograms using the Python programming language.
Python and Matplotlib can be used to create static 2D plots. But Matplotlib has a secret power that can also be used to create dynamic auto-updating animated plots.
Let’s get started!
1. Importing Modules
We start off by importing all necessary modules/libraries which included numpy to create data, matplotlib in order to plot histograms and finally matplotlib.animation to plot animated plots.
We will also be importing the HTML function in order to convert the video to the HTML form.
import numpy as np
import matplotlib.pyplot as plt
import matplotlib.animation as animation
from IPython.display import HTML
plt.style.use('seaborn')
2. Create a Dataset
In order to create data, we will be needing the numpy module by first fixing a random state in order to work with it. Next, we initialize the number of bins using the linespace function.
Next, we will create random 1000 data points using the linspace function. The final step is to convert the data points to histogram data points using the histogram function.
np.random.seed(19680801)
HIST_BINS = np.linspace(-4, 4, 100)
data = np.random.randn(1000)
n, _ = np.histogram(data, HIST_BINS)
3. Animating the Histogram
In order to animate the histogram, we need an animate function, that will generate some random numbers and keep updating the heights of the bins.
def prepare_animation(bar_container):

    def animate(frame_number):
        data = np.random.randn(1000)
        n, _ = np.histogram(data, HIST_BINS)

        for count, rect in zip(n, bar_container.patches):
            rect.set_height(count)

        return bar_container.patches

    return animate
3. Display Animated Histograms
With the help of the hist() function, one can get an instance of BarContainer( Collection of Rectangle instances ).
Then we will be calling the prepare_animation , which has the animate function defined under it.
Finally, we will be converting the plot into HTML format, using the to_html5_video function.
fig, ax = plt.subplots()
_, _, bar_container = ax.hist(data, HIST_BINS, lw=1,ec="red", fc="blue", alpha=0.5)
ax.set_ylim(top=55)
ani = animation.FuncAnimation(fig, prepare_animation(bar_container), 50,repeat=True, blit=True)
HTML(ani.to_html5_video())
Complete Implementation to Display Animated Histograms in Python
import numpy as np
import matplotlib.pyplot as plt
import matplotlib.animation as animation
from IPython.display import HTML
plt.style.use('seaborn')

np.random.seed(19680804)
HIST_BINS = np.linspace(-4, 4, 100)
data = np.random.randn(1000)
n, _ = np.histogram(data, HIST_BINS)

def prepare_animation(bar_container):

    def animate(frame_number):
        data = np.random.randn(1000)
        n, _ = np.histogram(data, HIST_BINS)

        for count, rect in zip(n, bar_container.patches):
            rect.set_height(count)

        return bar_container.patches

    return animate

fig, ax = plt.subplots()
_, _, bar_container = ax.hist(data, HIST_BINS, lw=1,ec="blue", fc="yellow", alpha=0.5)
ax.set_ylim(top=100)
ani = animation.FuncAnimation(fig, prepare_animation(bar_container), 50,repeat=True, blit=True)
HTML(ani.to_html5_video())
Conclusion
I hope you had fun watching the animated histograms! You can try this with different data, number of bins, and even change the speed of the histograms as well.
Happy Coding! 😊
Read More
- Python Plot: Create Animated Plots in Python
- 3 Matplotlib Plotting Tips to Make Plotting Effective
- Python: Plotting Smooth Curves
