🚀 Supercharge your YouTube channel's growth with AI.
Try YTGrowAI FreeMachine Learning In Python – An Easy Guide For Beginner’s

The concept of Machine Learning is a recent development in the field of Artificial Intelligence. Many of the field experts say that AI is the future of humanity and it can help in many ways. This term has its origin from the 1950s from the most famous mathematician Alan Turing.
He is the inventor of the first digital computer. Firstly hats off to him and other computer scientists who also have a contribution with them. Let us move towards the complete road map to ML and its development.
What Is Machine Learning?
Machine Learning is the ability of computers to learn and function without being explicitly programmed. This is the most famous definition today all beginners learn and apply. Now let us make sure that we take look at the flowchart and make sure how it has links with another branch of Artificial Intelligence.
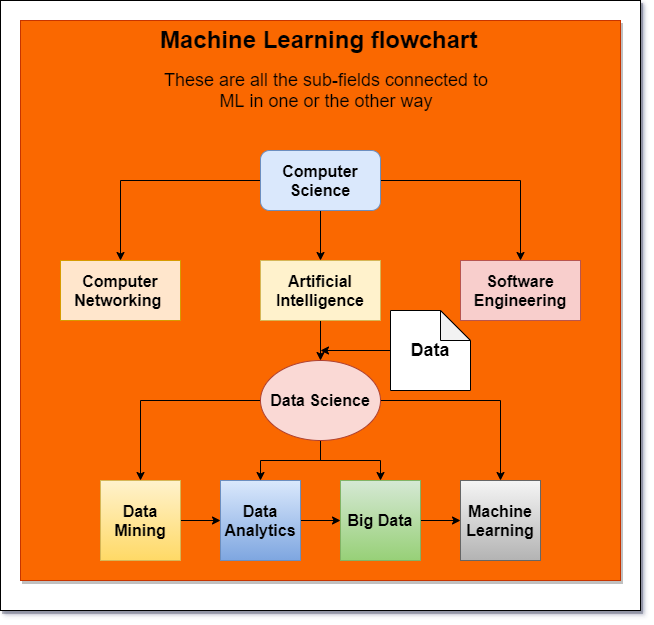
As we can see that it has emergence from Computer Science as the core subject. Artificial Intelligence has one main sub-branch known as Data Science. It splits into four subfields:
- Data Mining
- Data Analytics
- Big Data
- Machine Learning (ML)
Now, if we observe the chart shows us that Data is the main dependency of AI. Without any data or information, we cannot do anything. It needs to be present in raw format for analysis and processing.
Maintaining all other factors we also see that all the four sub-fields of Data Science have a core dependency among themselves.
This shows that learners need to have some basic knowledge about other fields to make a career in one o them. That is why A. It is an upcoming different career opportunity for students.
Roadmap For Learning Machine Learning in Python
This section will show you how we can start to learn Machine Learning and make a good career out of it. This is a complete pathway to follow:
- Probability and Statistics: First start with the basics of Mathematics. Learn all the basics of statistics like mean, median and mode. topics like Regression, curve fitting are also important.
- Graphs for visualization: Various graph plots like bar graphs, scatter plots, line plots, line plots etc. are important for data visualization.
- Programming Language: A programming language is a must to learn ML. Because, we can depend for complex mathematical operations on a computer but, to fetch, represent and analyze data they prove to be most useful. Python and R are most famous among the Data Science enthusiasts ad ML engineers.
- Libraries: We need to have strong understanding of various development libraries for data analysis of the programming language we choose for ML. They help us in numerical computing, data preprocessing, easy algorithm implementation and to visualize the data.
- Algorithms: Various algorithms are important for various predictions. Naive Bayse , Linear Regression, Decision Trees, Random Forests, XGBosst etc. with their theory is important.
- Data processing techniques: To convert raw data into useful and manageable one, we should have the skill of data preprocessing. Various encoding techniques like One Hat Encoding and Label Encoding are important.
Let us see some of these points in detail.
Why Choose Python For Machine Learning?
When it comes to an easy to learn and understand programming language Python is the developers’ choice.
In general, they are the tool through which we can implement our ideas and maintain a professional workflow.
Codes help people to share and understand their knowledge in a particular structure.
Python is a lightweight general-purpose programming language. It is an open-source project. So, we can contribute to its development.
Visit https://www.python.org/ for more info.
The main feature of python is that It is object-oriented (OOP).
Unlike other OOP languages the instantiation of a class, inheritance, multiple inheritances, encapsulation techniques are all very easy to implement in Python.
Also, it has extensive library support for various applications like web development, Graphical User Interface (GUI) Development, Software Development, Data Science, and Machine Learning. For Machine Learning Python provides the following libraries:
- Pandas :
- Numpy
- Matplotlib
- Seaborn
- Scipy
- Scikit Learn
These are the six main libraries through which we can perform various ML operations. For advanced ML there are other sets of five main libraries:
- Tensorflow.
- OpenCV
- Pytorch
- Keras
- Statsmodels
Overview Of The Libraries Mentioned Above
Pandas
We will start with the most important library used to do the appropriate data cleaning and preprocessing.
The Pandas library. Mainly it is been built on the Numpy and Matplotlib packages of python. Data preparation is the most essential task in creating ML models. So, it is this library that makes it a bit easier.
We all know that a machine understands It can encode data and create the dummy variables to prepare the test data for model training. Visit the link for its documentation and tutorial.
Numpy
The full form is numerical python. Mostly it is in use for the calculation of multidimensional complex arrays and matrices, mathematical computations, and scientific calculations.
The library has proved to be best for the training of models that ML engineers prepare. IT is powerful and has a data type of ndarray. The latest version is Numpy-1.21 in use. For more info visit the official website https://numpy.org/doc/.
Matplotlib
This library is for plotting the graphs for data visualization and presentation purposes. A very suitable and easy-to-use API for data science and machine learning purposes. It can plot the following graphs. It has two categories of plots 2D and 3D plots.
The 2-Dimensional plots include:
- Scatter plots
- Bar plots
- Line plots
- Pie charts
- Box plots
- Frequency distributions
- Histogram
- Curves and many more
The 3-Dimensional plots include:
- 3D line plots
- Wireframe plots
- Surface plots
- Tri surface plots
We can also analyze images using a special submodule inside matplotlib. It is the image module.
Advance scaling features include image plotting and pseudo color schemes. Visit this link for more info.
Here is the sample image of some:

Seaborn
This library is used for statistical plotting. Just like matplotlib, we can draw attractive plots of various data-frames. We can also visualize different regression models, functions and it has the special feature of drawing multi plots for the different variables of the same data frame. These are some sample plots:

Scipy
Scipy means scientific python. This library is mostly similar to NumPy. But, the core difference is that it provides special functions for physics and advanced mathematics.
Topics like hypergeometry, parabolic cylinders, etc are available under this API. Also, it has a set of exponential and trigonometric functions to support complex calculations.
The main plus point of Scipy over NumPy is it helps to calculate calculus problems like integrations and derivations. to know more about this package, view the link for user_guide.
Overview Of Different Machine Learning Algorithms
Now let’s get right to the different machine learning algorithms that are available, how they behave. This section will help you understand which type of machine learning technique will suit specific purposes based on the need.
Machine Learning Techniques
A machine learns in two different techniques:
- Supervised Learning: The concept in which the model learns under the supervision and labelled data. We label the data with some unique values and then we train the model according to our need.
- Unsupervised Learning: The concept in which the model learns by itself using the unlabeled data. We only need to do some data cleaning and then leave the other predictions in the hands of machine.
Machine Learning Algorithms
Without algorithms, Machine Learning is just a dream of one night. Thus, one should have proper knowledge of all the basic algorithms. They give the correct and relevant output for the user specification. They depend on the core statistical analysis. There are two main types:
- Classification: For discrete data or data varying in large value difference.
- Regression: For continuous data or data where values slightly change.
Both of them have the same algorithms but they differ by creation. Below is a list of the seven most essential and important algorithms an AI/ML practitioner should be aware of.
- Linear Regression: Find the best fit line among the flow of data points on the graph.
- Logistic Regression: Finding the probability on a particular condition using a curve.
- Decision Trees: Making decisions based on the different conditions of nodes of a tree.
- Random Forests: A collection of various decision trees that work on prediction of decisions for a big amount of data.
- Support Vector Machines: Separating data points into classes for analysis
- k-means clustering algorithm: Create clusters of different data points and detecting the odd ones among them.
- k-nearest neighbors: finding the nearest neighbor for the data point on a particular test case.
How To Perform Machine Learning With Python – An Easy Example
For beginners, you are asked to solve business problems and test cases. This is also known as Predictive Analysis.
Now, we have the major tools and technologies for ML and we know what is ML.
Let us apply some concepts and do our ML journey a good start. ML is a step-wise pattern of ordering a machine to learn. So, to make a start we will implement a Linear Regression algorithm with some plots in python.
For more information on Anaconda visit https://www.anaconda.com/products/individual
Based on the available data on salary of employees in Google on different positions, implement the Decision Tree Classifier Algorithm
- Environment: Anaconda
- IDE: Jupyter Notebook
- Operating System: Windows 10+
- Python Version: Python 3.8.5 (comes preinstalled with Anaconda)
- Dataset: salary.csv
1. Reading a dataset
Pandas module helps us read the dataset. It can be in any form like text, CSV, excel. Pandas module has different methods to read every file type. It can also read it through the given link on which the data API exits.
Code:
import pandas as pd
data = pd.read_csv('salary.csv')
data.head()

It is a CSV file so we use read_csv() method. Then we store it in a variable – ‘data’. To view the first five rows of the dataset use the head() method.
2. Checking the data types and shape of dataset
To know what type of variables exist in the dataset we need to make sure that we have a record of all their data types. To check it simple attribute types from pandas is always ready to use. And to count the number of rows and columns we have shape attributes. This returns a tuple of rows and columns
data.dtypes
data.shape

3. Check all the missing values
A dataset can be incomplete due to several reasons. The differences can be very huge and may lead to a wrong prediction. But, the isna() function scans all the values and returns the numbers if any columns have absent values. To check the total values we use the sum() function along with the isna().
Code:
data.isna().sum()

4. Selecting the target variable
The predictions depend on continuous variables that run along with the target variable. This variable is essential for the test case analysis. We can easily identify it if we have a nominal dataset. The given problem statement depicts that Salary is our main target variable. So, the column salary of more than 10,000rs is suitable for that.
Code:
inputs = data.drop('salary more than 10,000rs', axis = 'columns')

target = data['salary more than 10,000rs']

5. Labelling the dataset
For a supervised learning model, we need labeled data. Because it is the core property of this type of ML algorithm.
This can be done using the sci-kit-learn library’s preprocessing module.
We import the LabalEncoder() class from that. The fit_transform() function labels the relevant data for the machine to understand. We create three instances of that class for each column.
from sklearn.preprocessing import LabelEncoder
le_company = LabelEncoder()
le_job = LabelEncoder()
le_degree = LabelEncoder()

inputs['company_n'] = le_company.fit_transform(inputs['company'])
inputs['job_n'] = le_job.fit_transform(inputs['job'])
inputs['degree_n'] = le_degree.fit_transform(inputs['degree'])

Thus, three new columns get added to the dataset.

Then after getting the labeled data, we drop the unrequired columns. Then the new name to the dataset is given to it as inputs_n.
Code:
inputs_n = inputs.drop(['company','job','degree'],axis='columns')
inputs_n


6. Implementing the algorithm
We implement the Decision Tree algorithm of the Classifier type because the data available is in discrete form. We import it from the scikit-learn’s tree module. The code is given below.
Code:
from sklearn.tree import DecisionTreeClassifier
model = DecisionTreeClassifier()

model.fit(inputs_n, target)

model.score(inputs_n,target)

model.predict([[2,1,0]])

model.predict([[2,1,1]])

Explanation:
- We create an instance of the DecisionTreeClassifier class. Then to make predictions we use the fit function. This function takes two parameters: The target variable and the continuous variable. This implements the algorithm concerning parameters.
- Then check the score of the training score using the score() function. It ranges from 0 to 1. If the score is 1 then the model is 100% accurate. The percentage is determined by the point using the numbers before the decimal point. For example, Our score is 0.78 then the training percentage is 78%.
- The predict function takes an array of inputs as a parameter. This gives the results. We give three inputs to that array. Because we have three test variables 1) company_n, 2) job_n 3) degree_n.
- The algorithm will compare the target variable for each input and whether the salary will be more than Rs.10,000. If the answer is 1 then the person earns more than ten thousand rupees but, if the answer is 0 then that person does not earn more than Rs.10,000.
Machine Learning In Real World
Machine Learning has a vast number of applications and also it is in use in various fields. The six major fields are:
- Technology
- Industry
- Finance
- E-Commerce
- Internet of Things (IoT)
- Weather Reports
Conclusion
Hence, we learned how to perform Machine Learning in Python. We learned about the various libraries and their uses. Follow through this post to get a headstart on your Machine Learning journey. A lot has to be covered, and a lot more will be covered. So make sure you read through everything that we already have within this article to get yourself started with the most major aspects of Machine learning in Python.


